DNA Dashboard
The DNA Dashboard provides a centralized view of DNA testing progress and results across the organization. It summarizes key performance indicators (KPIs) from mitochondrial (Mito), autosomal (AuSTR), and Y-STR analyses, allowing administrators and analysts to monitor laboratory efficiency, report generation, and sequencing outcomes.
Navigation
From the main sidebar, click on DNA Dashboard under the DNA section. The interface will display a set of visual KPI widgets and line chart representing summarized data for all DNA records.
This dashboard integrates live data from the DNA module - including fields such as sample methods, received dates, sequencing counts, and report statuses.
Widget Features
Each widget in the DNA Dashboard comes with standard features similar to other dashboards:
- Last Updated Timestamp - Shows when the DNA data was last updated

- Mouse Over Detail - Hover over charts for detailed DNA statistics
- View Details (Drill Into The Data) - Click for detailed DNA sample information
-
Widget Controls:
-
Collapse - Minimize the widget to save space while keeping it accessible
- Close - Remove the widget from the dashboard view
- Help-Cora Docs - Access detailed documentation and usage guides
Pie Chart Visualization
Most DNA metrics are displayed as pie charts showing:
- Clear color coding for different categories
- Percentage distribution
- Interactive tooltips on hover
- Detailed legends
Chart Visualization Types
The DNA Dashboard offers three different chart styles to effectively visualize data distributions:
1 Full Pie Chart
The traditional 360-degree circular chart that shows the complete proportion of all components. Best used for:
- Displaying part-to-whole relationships
- Comparing multiple categories
- Showing percentage distributions
- Visualizing complete data sets with clear segment differences
2 Half Pie Chart
A 180-degree semicircular visualization that offers a more compact view. Ideal for:
- Space-efficient data presentation
- Binary comparisons (e.g., Completed vs. Pending)
- Dashboard layouts where vertical space is limited
- Emphasizing simple proportional relationships
3 Donut Chart
A circular chart with a hollow center that emphasizes individual segments. Particularly effective for:
- Focusing on individual segment values
- Displaying additional information in the center
- Multi-layer data presentation
- Emphasizing the relationship between parts while maintaining visual distinction
Each chart type maintains interactive features such as hover tooltips, click-through capabilities, and real-time updates.
General Notes
- Each chart segment is clickable and supports drilldown exploration.
- Hovering over segments shows precise counts and percentages.
- Widgets update automatically when DNA data changes or processing is completed.
- Timestamps indicate the last data refresh.
- All widgets maintain consistent color coding across the dashboard.
- Data can be exported in multiple formats (CSV, PDF, Print).
- Filters allow focusing on specific date ranges or sample types.
KPI Widgets
KPIs in the DNA Dashboard are interactive visual elements that provide real-time insights into critical DNA testing metrics.
The widgets are categorized into three main DNA testing areas:
- Mitochondrial DNA (Mito) - Maternal lineage analysis
- Autosomal DNA (AuSTR) - Genetic inheritance patterns
- Y-chromosome DNA (Y-STR) - Paternal lineage tracking
Below is a comprehensive description of each widget available in the DNA Dashboard, including their purpose, data interpretation guidelines, and practical applications in DNA analysis workflows.
DNA Mito Results
A comprehensive pie chart showing the distribution of mitochondrial DNA testing results
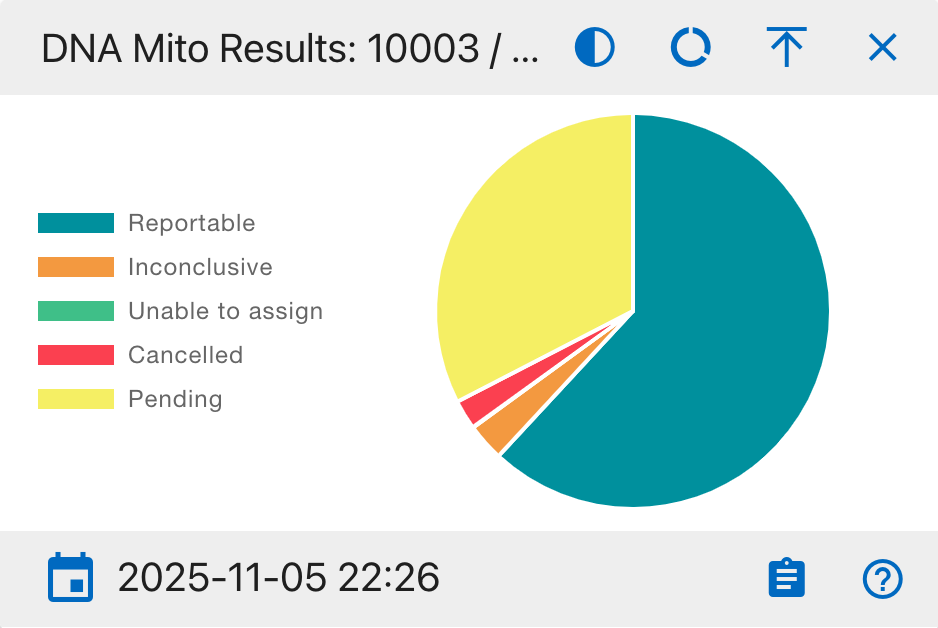
Pie Chart Segments:
- Reportable
- Inconclusive
- Unable to assign
- Cancelled
- Pending
This widget helps analysts track testing progress and identify potential bottlenecks in the DNA analysis workflow.
DNA Mito Methods
A comprehensive view of DNA sequencing methods used in the laboratory
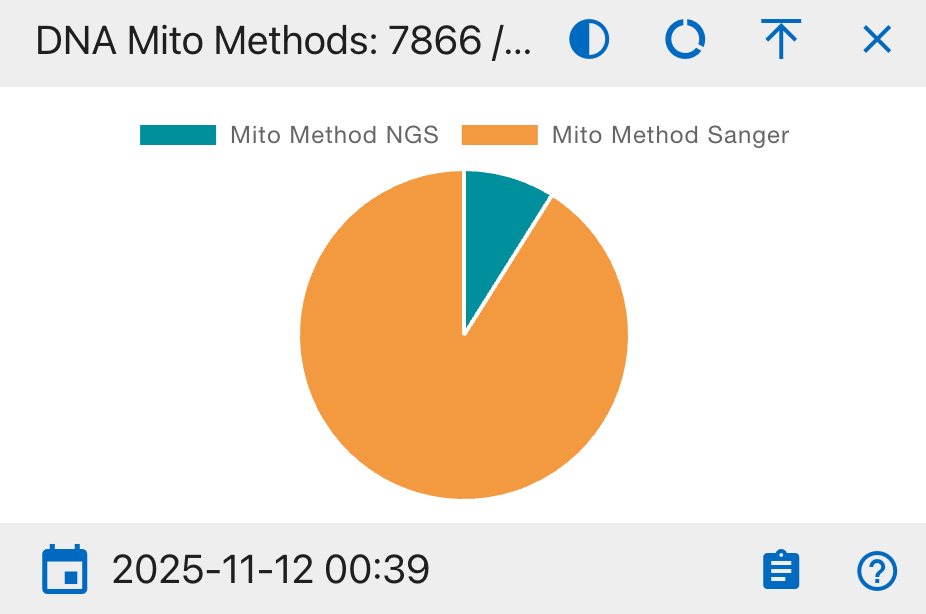
Pie Chart Segments:
- Mito Method NGS
- Mito Method Sanger
This widget helps track the adoption of different sequencing technologies and monitor resource allocation across methods.
DNA Mito Counts
A statistical overview of DNA sample matching status
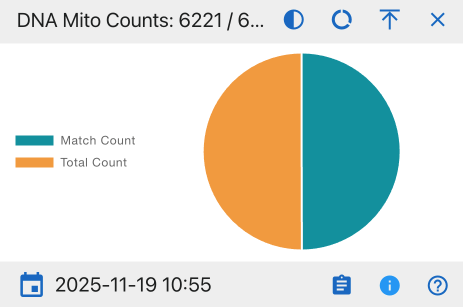
Pie Chart Segments:
- Match Count
- Total Count
This widget provides insights into the success rate of DNA matching processes and helps evaluate overall testing efficiency.
DNA Mito Dates
A timeline analysis of DNA sample processing status
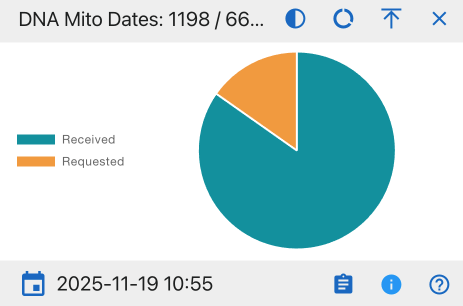
Pie Chart Segments:
- Received
- Requested
This widget helps monitor laboratory workflow efficiency and identify potential processing backlogs.
DNA Mito Sequence
A detailed breakdown of DNA sequence categorization
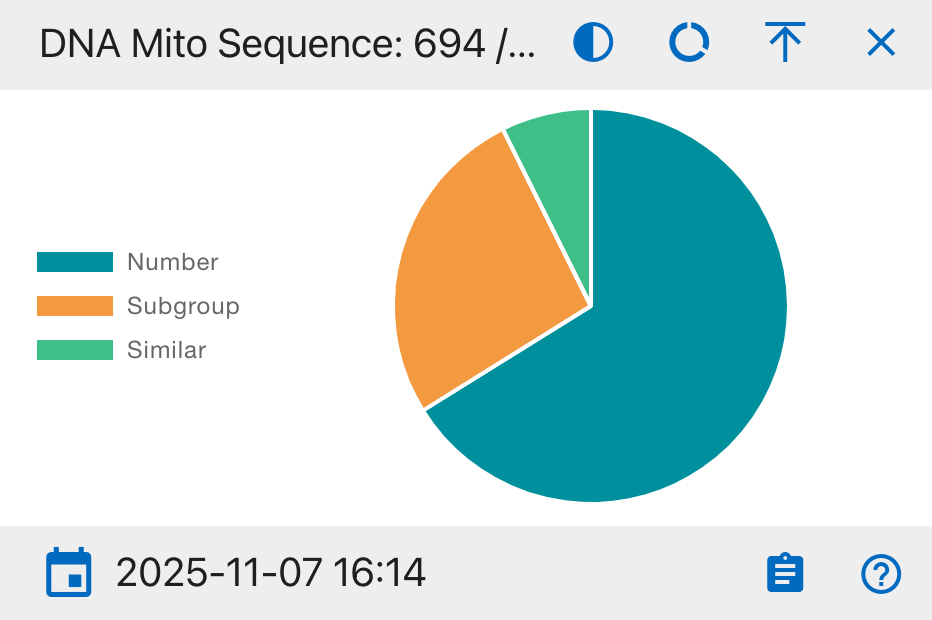
Pie Chart Segments:
- Number
- Subgroup
- Similar
This widget facilitates the identification of sequence patterns and potential familial connections in the database.
DNA Mito Haplogroup
A tracking system for ancestral lineage classification
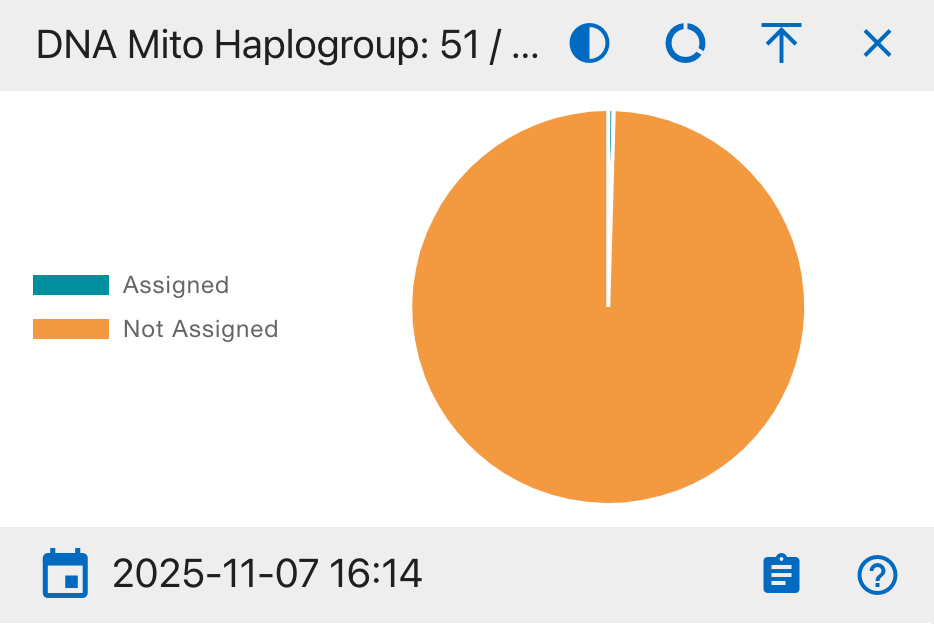
Pie Chart Segments:
- Assigned
- Not Assigned
This widget monitors the progress of maternal lineage classification and geographical origin determination.
DNA Mito Confirmed Regions
A quality assurance overview of DNA region verification
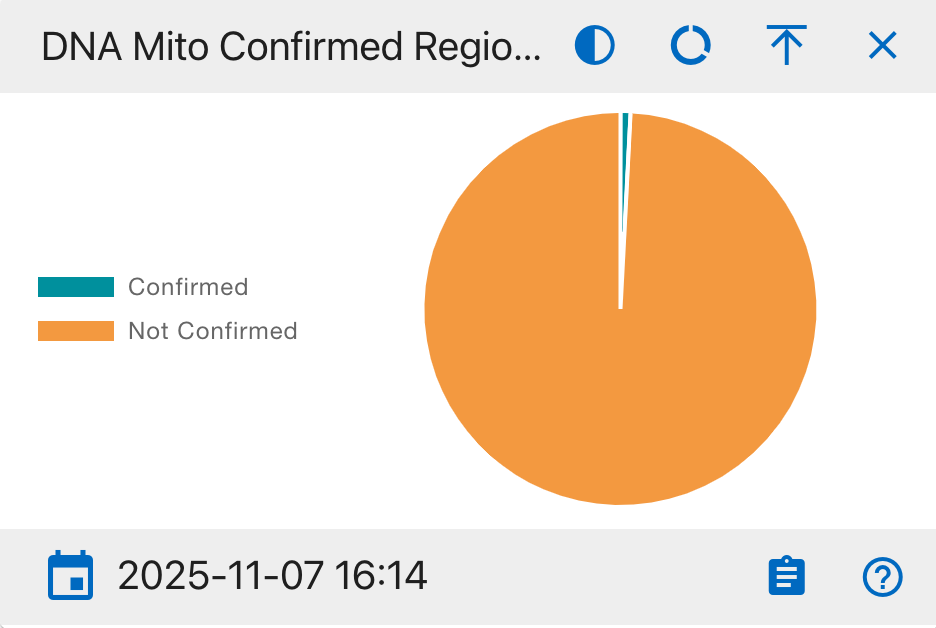
Pie Chart Segments:
- Confirmed
- Not Confirmed
This widget is essential for quality control processes and helps ensure the accuracy of DNA analysis results. It tracks the verification status of analyzed DNA regions.
DNA Mito Base Pairs
A detailed view of base pair sequencing completion
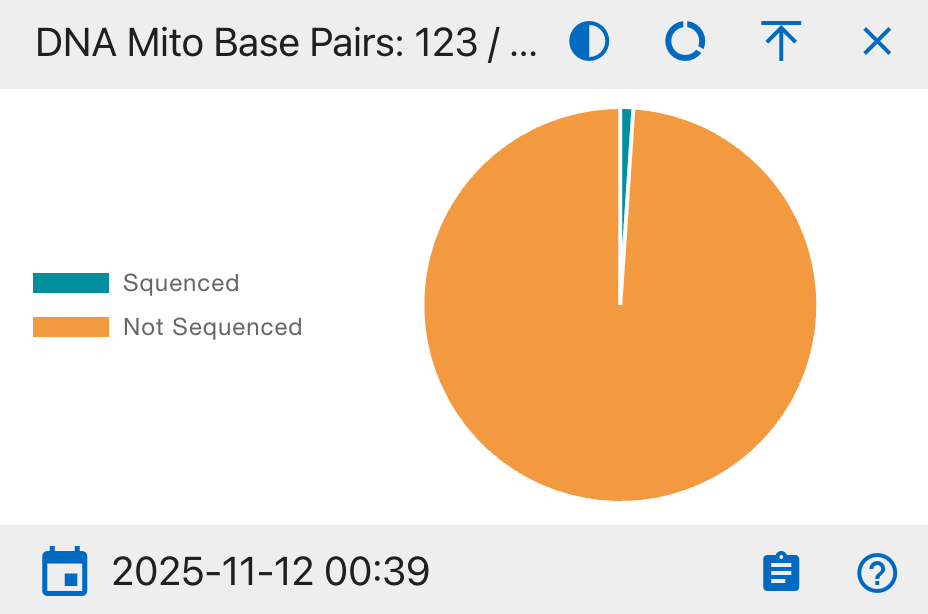
Pie Chart Segments:
- Sequenced
- Not Sequenced
This widget monitors the granular progress of DNA sequencing at the base pair level, crucial for ensuring complete genetic analysis coverage.
DNA Mito Polymorphisms
An analysis of genetic variation patterns in mitochondrial DNA
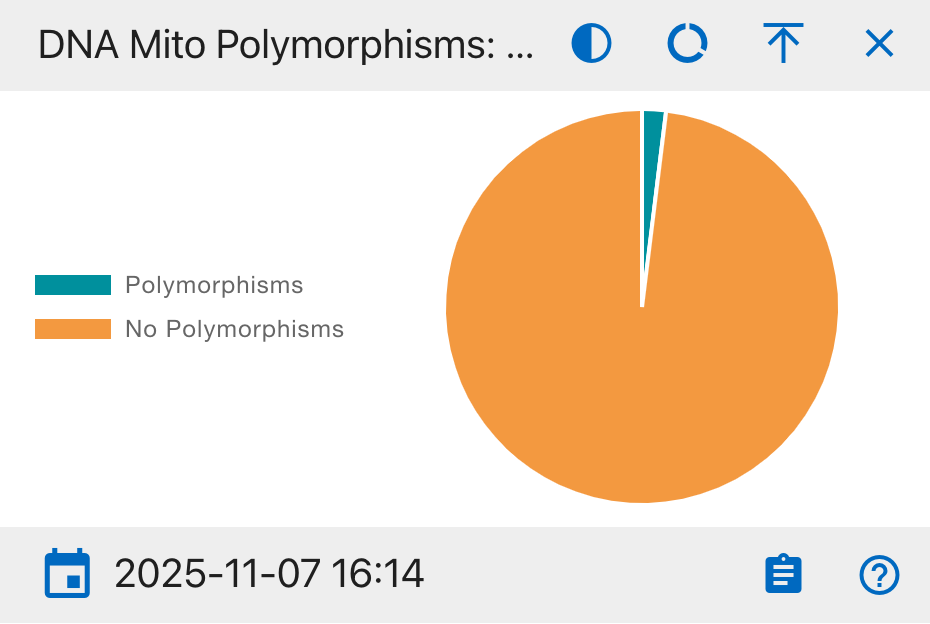
Pie Chart Segments:
- Polymorphisms
- No Polymorphisms
This widget helps identify genetic diversity by tracking the presence of DNA sequence variations, essential for population genetics studies and individual identification.
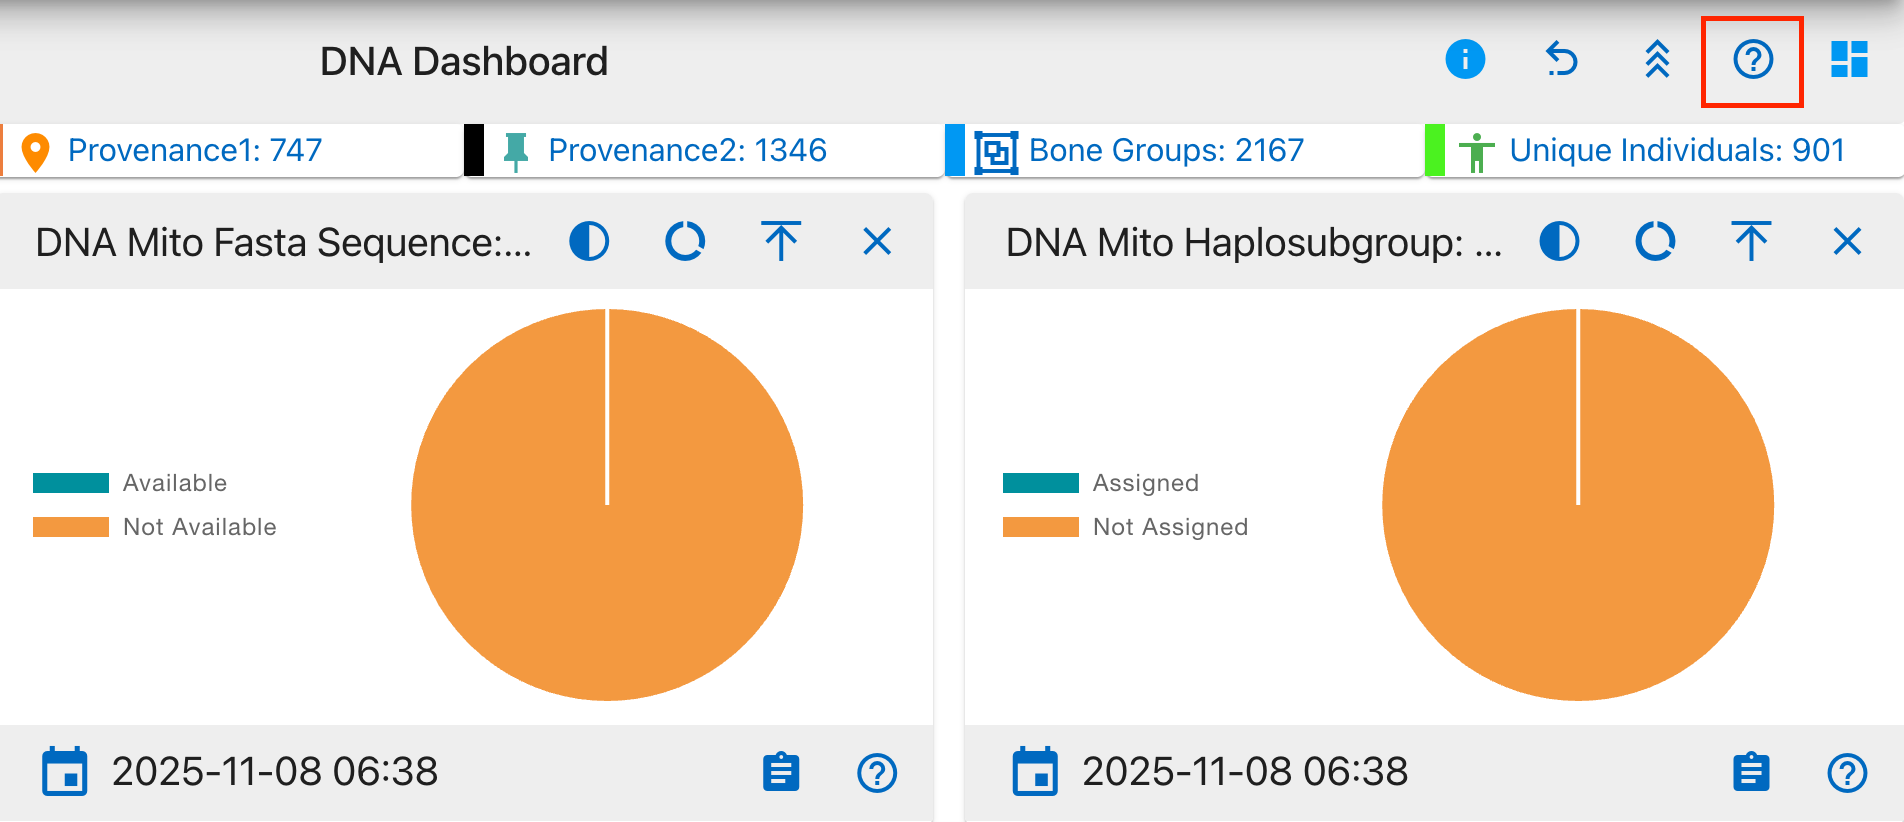
DNA Mito Fasta Sequence
A tracker for standardized DNA sequence file availability
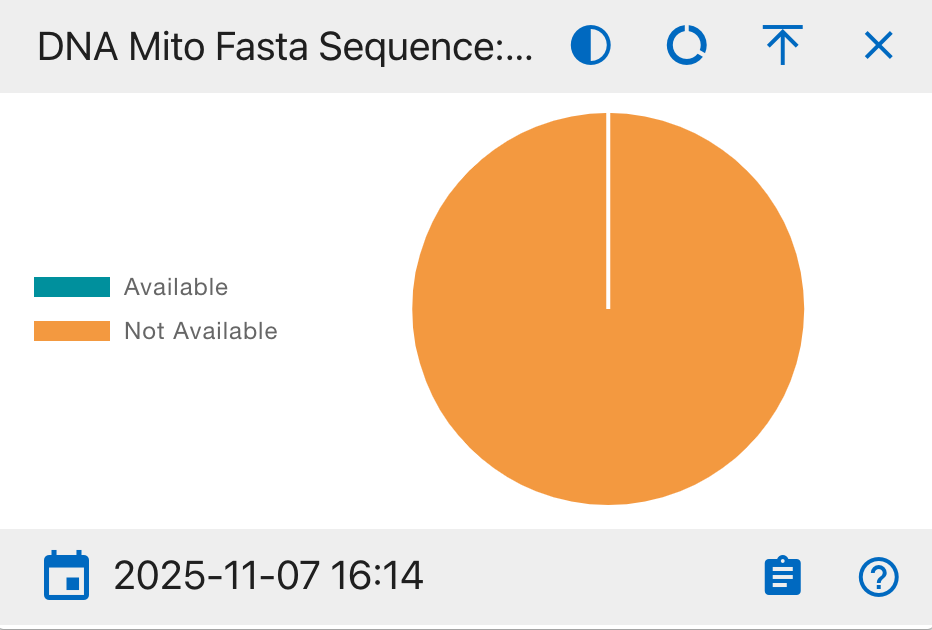
Pie Chart Segments:
- Available
- Not Available
This widget monitors the availability of DNA sequences in the standardized FASTA format, which is essential for bioinformatics analysis and data sharing between systems.
DNA Mito Haplosubgroup
A detailed breakdown of mitochondrial DNA subgroup classifications

Pie Chart Segments:
- Assigned
- Not Assigned
This widget tracks the detailed classification of maternal lineages into specific subgroups, providing finer granularity for population genetics and ancestry studies.
DNA Mito Loci
A status overview of genetic marker analysis progress
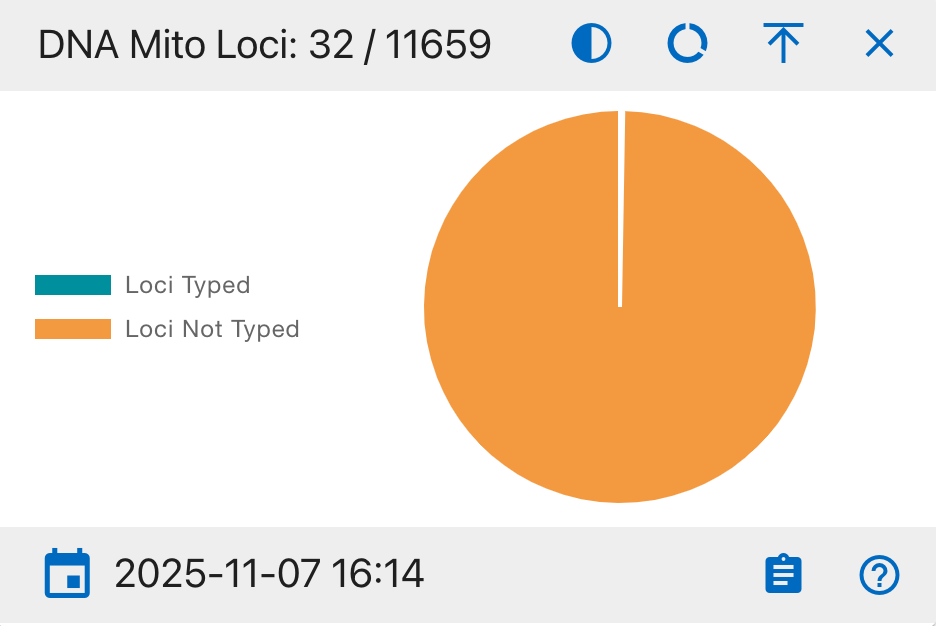
Pie Chart Segments:
- Loci Typed
- Loci Not Typed
This widget monitors the progress of genetic marker typing, essential for comprehensive DNA profiling and accurate genetic comparisons.
DNA Mito MCC Dates
A tracking system for Multi-Copy Control review status
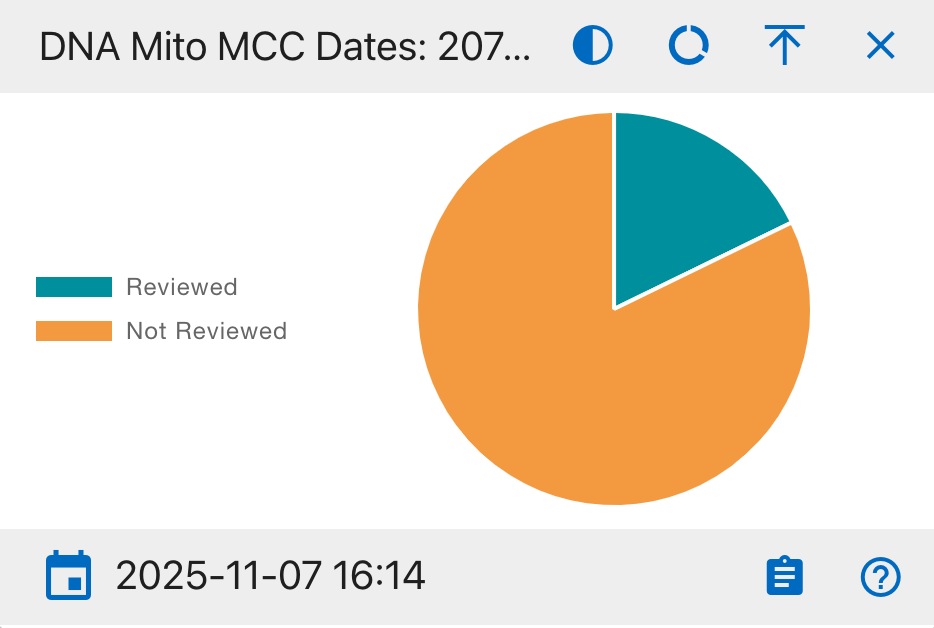
Pie Chart Segments:
- Reviewed
- Not Reviewed
This widget monitors the progress of Multi-Copy Control (MCC) reviews, which are critical for quality assurance and validation of DNA analysis results.
DNA Sample Condition
A comprehensive tracker for physical DNA sample status
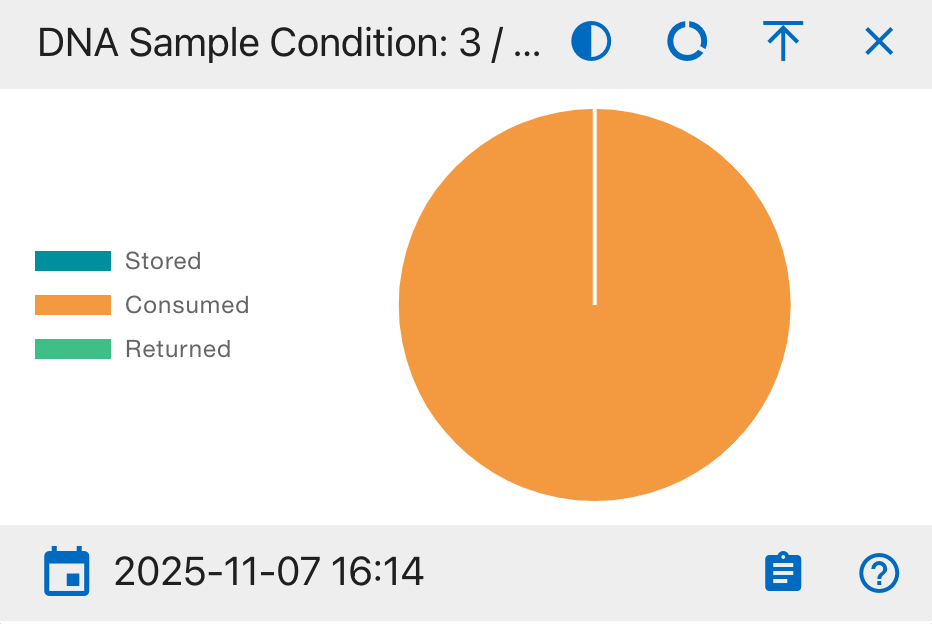
Pie Chart Segments:
- Stored
- Consumed
- Returned
This widget provides crucial inventory management information, tracking the physical status and location of all DNA samples throughout their lifecycle.
DNA Resampled
A tracking system for DNA sample retesting status
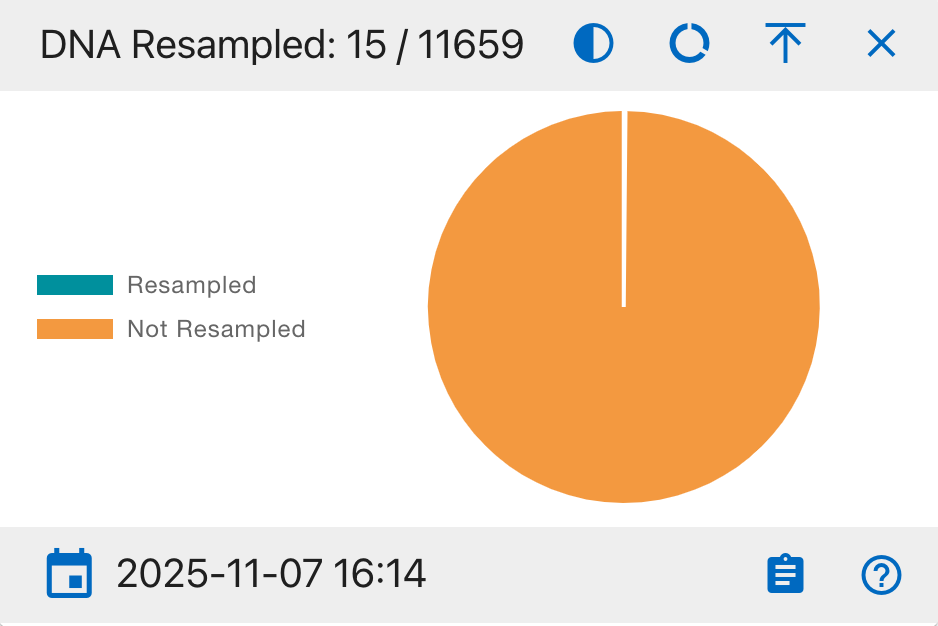
Pie Chart Segments:
- Resampled
- Not Resampled
This widget monitors the frequency of DNA resampling, helping identify quality control patterns and potential testing issues.
DNA BTB Dates
A timeline comparison of DNA testing requests and results
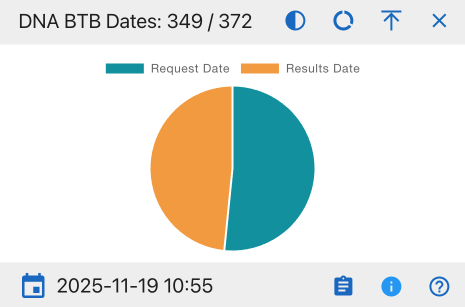
Pie Chart Segments:
- Request Date
- Results Date
This widget helps track the turnaround time between DNA test requests and result availability, supporting workflow optimization.
DNA Austr Methods
A comprehensive overview of austr DNA testing method assignments
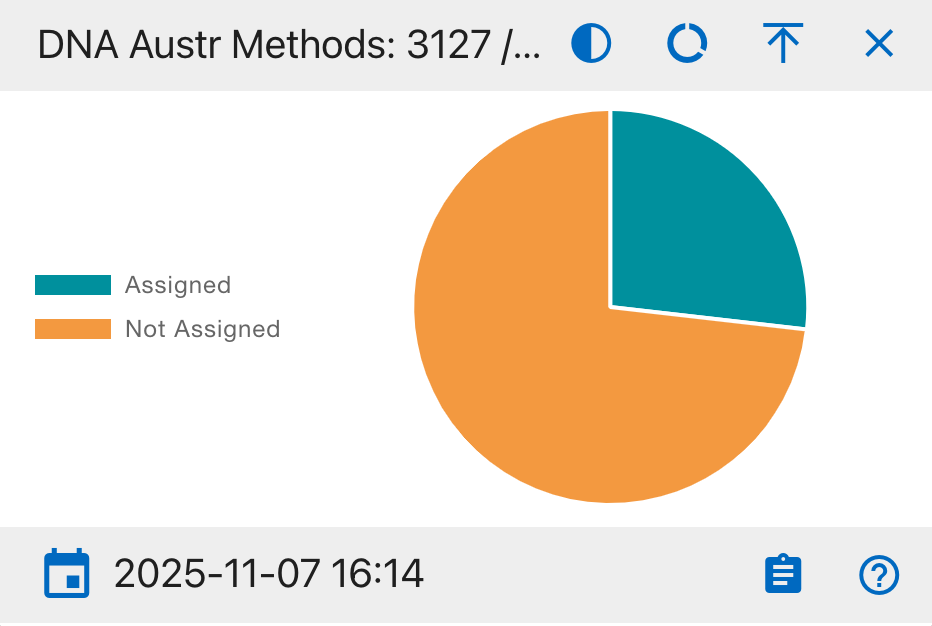
Pie Chart Segments:
- Assigned
- Not Assigned
This widget helps track the status of method assignments for austr DNA testing, ensuring proper testing protocols are followed and identifying samples that need method designation.
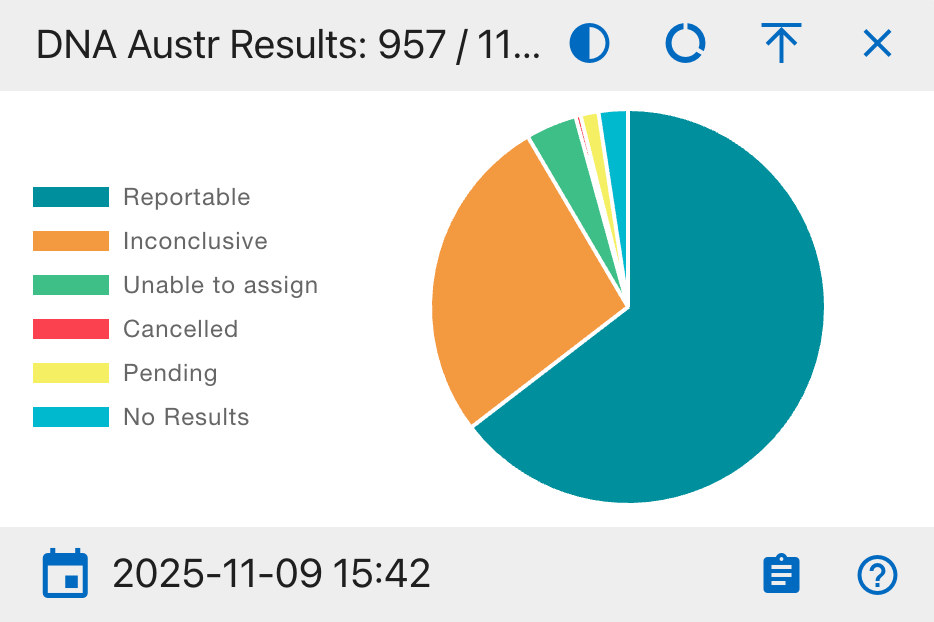
DNA Austr Results
A comprehensive overview of austr DNA testing outcomes
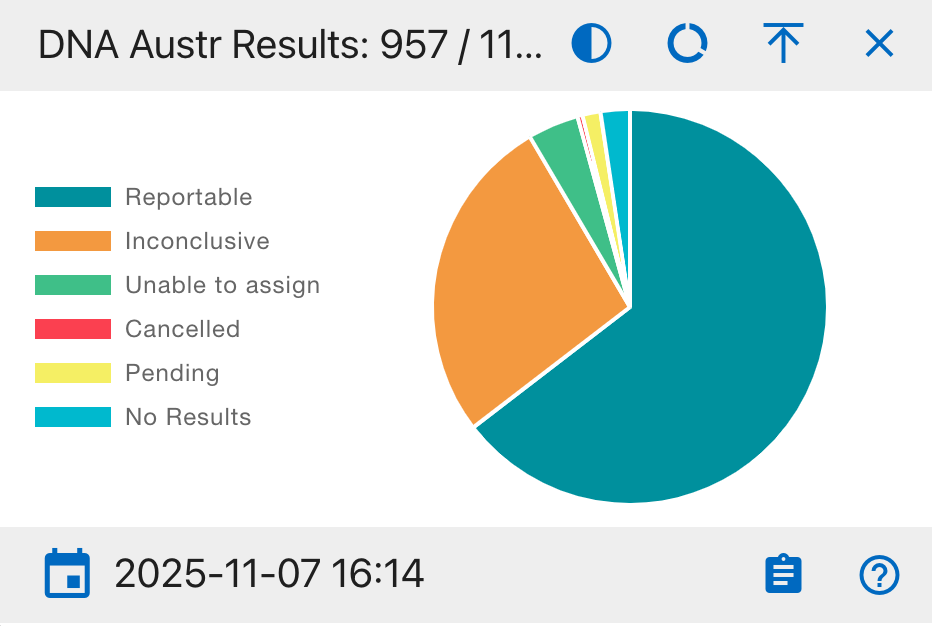
Pie Chart Segments:
- Reportable
- Inconclusive
- Unable to assign
- Cancelled
- Pending
- No Results
This widget provides a complete view of austr DNA testing outcomes, helping analysts track success rates and identify potential issues in the testing process.
DNA Austr Dates
A timeline analysis of austr DNA sample processing
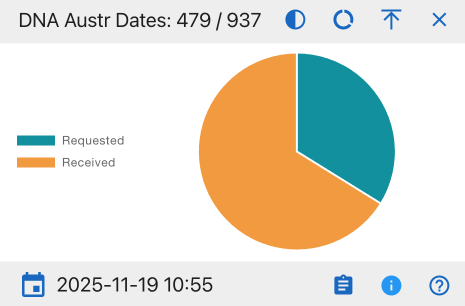
Pie Chart Segments:
- Requested
- Received
This widget monitors the flow of austr DNA samples through the laboratory system, helping identify processing bottlenecks.
DNA Austr Sequence
A categorical analysis of austr DNA sequence data
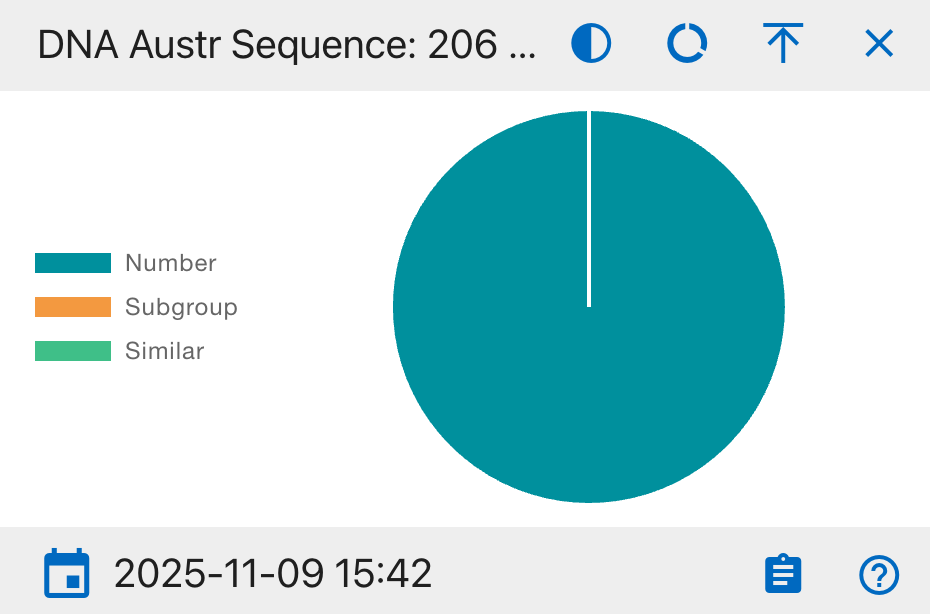
Pie Chart Segments:
- Number
- Subgroup
- Similar
This widget provides insight into the distribution and relationships of austr DNA sequences, helping identify patterns and potential matches.
DNA Austr Loci
A status overview of austr DNA marker analysis

Pie Chart Segments:
- Loci Typed
- Loci Not Typed
This widget tracks the progress of genetic marker typing for austr DNA, essential for complete DNA profiling and identification.
DNA Austr MCC Dates
A tracking system for austr DNA Multi-Copy Control review status
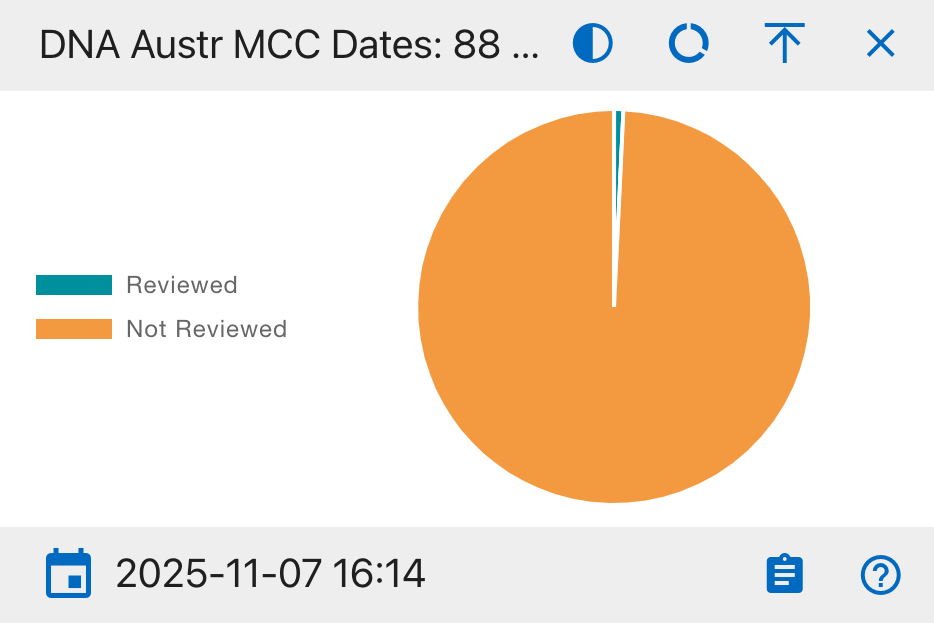
Pie Chart Segments:
- Reviewed
- Not Reviewed
This widget monitors the progress of Multi-Copy Control (MCC) reviews for autosomal DNA samples, ensuring quality control standards are met.
DNA YStr Methods
A comprehensive overview of YStr DNA testing method assignments
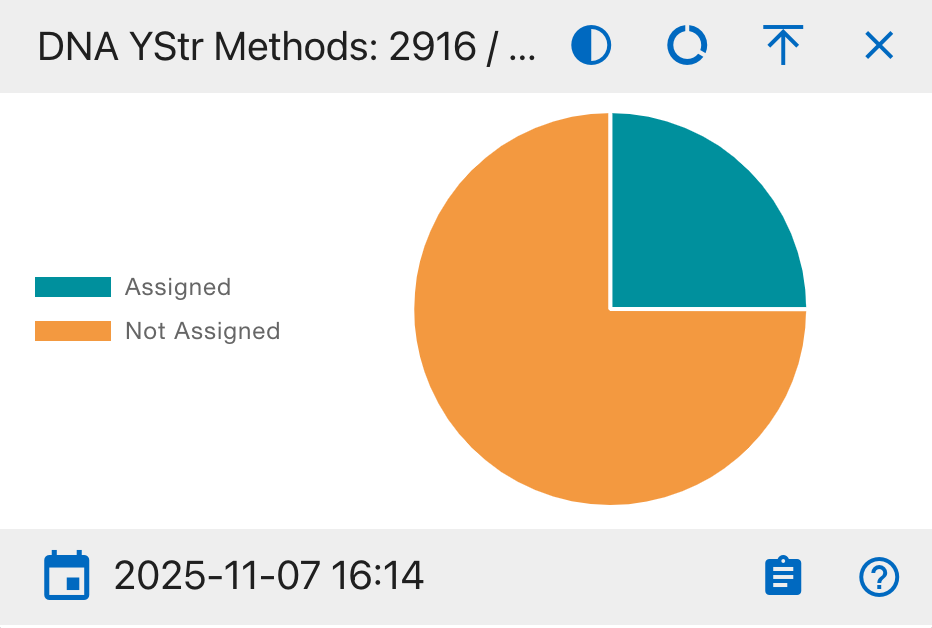
Pie Chart Segments:
- Assigned
- Not Assigned
This widget tracks the status of method assignments for YStr DNA testing, ensuring appropriate testing protocols are followed.
DNA YStr Results
A comprehensive overview of YStr DNA testing outcomes

Pie Chart Segments:
- Reportable
- Inconclusive
- Unable to assign
- Cancelled
- Pending
- No Results
This widget provides a complete view of YStr DNA testing outcomes, helping analysts track success rates and identify potential issues in the testing process.
DNA YStr Dates
A timeline analysis of YStr DNA sample processing status
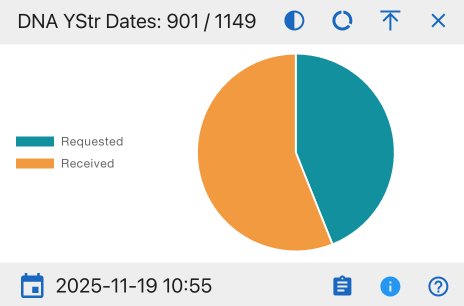
Pie Chart Segments:
- Requested
- Received
This widget helps monitor laboratory workflow efficiency and identify potential processing backlogs by tracking the number of YStr DNA samples requested versus those received.
DNA YStr Sequence
A categorical analysis of Y-STR DNA sequence data
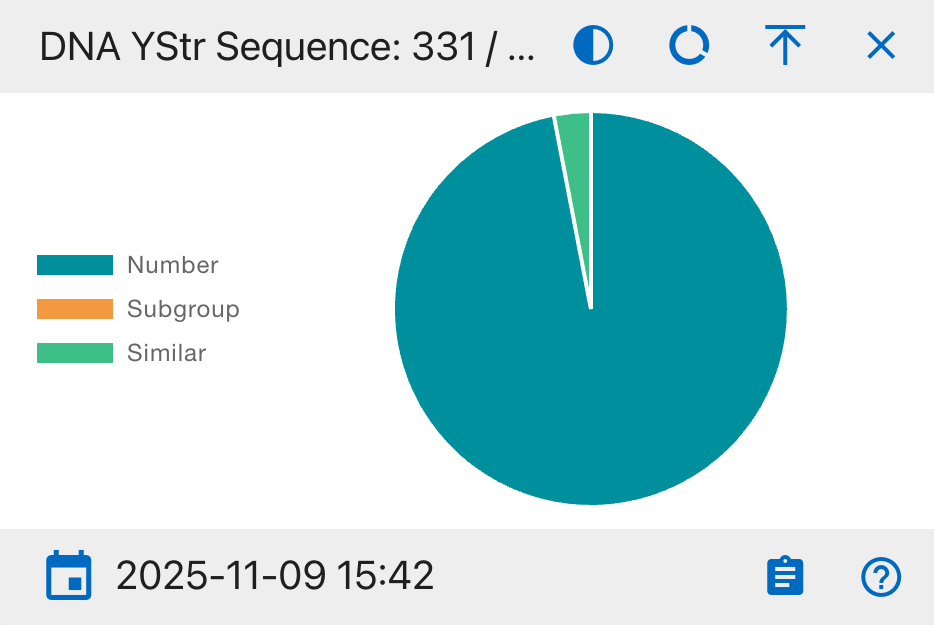
Pie Chart Segments:
- Number
- Subgroup
- Similar
This widget provides insight into the distribution and relationships of YStr DNA sequences, helping identify patterns and potential matches.
DNA YStr Loci
A status overview of Y-STR DNA genetic marker analysis

Pie Chart Segments:
- Loci Typed
- Loci Not Typed
This widget tracks the progress of genetic marker typing for YStr DNA samples, essential for complete DNA profiling and identification.
DNA YStr Counts
A statistical overview of Y-STR DNA sample matching status
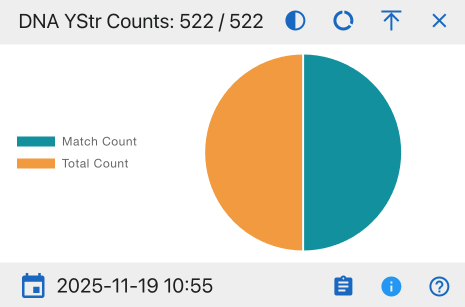
Pie Chart Segments:
- Match Count
- Total Count
This widget provides insights into the success rate of YStr DNA matching processes and helps evaluate overall testing efficiency.
DNA YStr MCC Dates
A tracking system for Y-STR DNA Multi-Copy Control review status
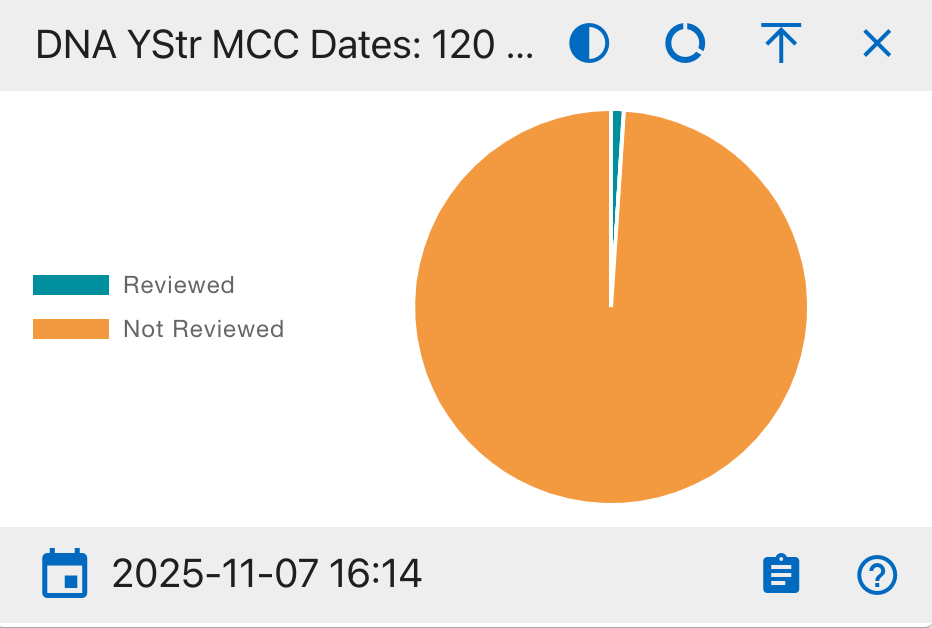
Pie Chart Segments:
- Reviewed
- Not Reviewed
This widget monitors the progress of Multi-Copy Control (MCC) reviews for YStr DNA samples, which are critical for quality assurance and validation of DNA analysis results.
DNA line Chart
The bottom section features a comprehensive DNA timeline showing multiple data series in a line graph format:
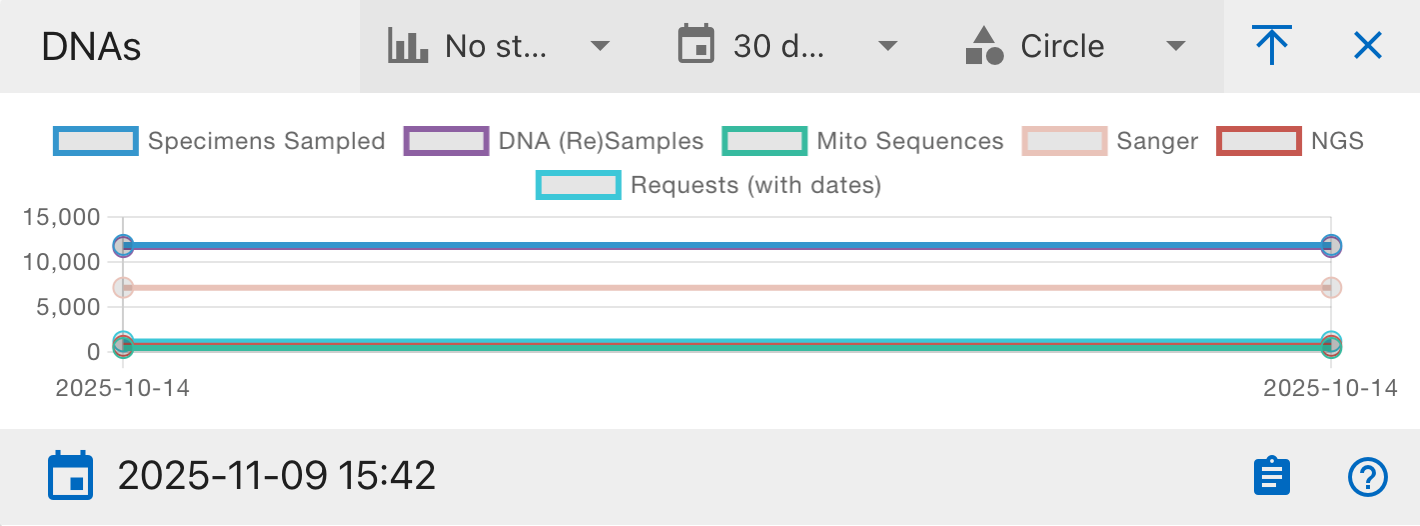
Data Series:
- Specimens Sampled
- DNA (Re)Samples
- Mito Sequences
- Sanger
- NGS
- Requests
The Y-axis shows the count (ranging from 0 to 15,000) while the X-axis shows the date range.
Graph Controls:
- No step/Step options - Toggle between continuous or stepped line visualization
- 30 days time range selector - Adjust the time window for analysis
- Circle point style option - Toggle data point markers
- Full screen toggle - Expand the graph for detailed viewing
The graph updates in real-time and shows the timestamp of the last update. This visualization helps track trends and relationships between different DNA processing stages over time.
Created: 2025-10-18