DNA Visualization - MitoPolymorphisms
Note
This page describes how to visualize mitochondrial DNA polymorphisms and the modified reference sequence using the CoRA Visualization Dashboard.
Accessing DNA Visualization
Navigate to the DNA section via:
Left Sidebar Menu → Visualizations → DNA - Mitochondrial
This section allows for the visualization of mitochondrial DNA data associated with specific specimens.
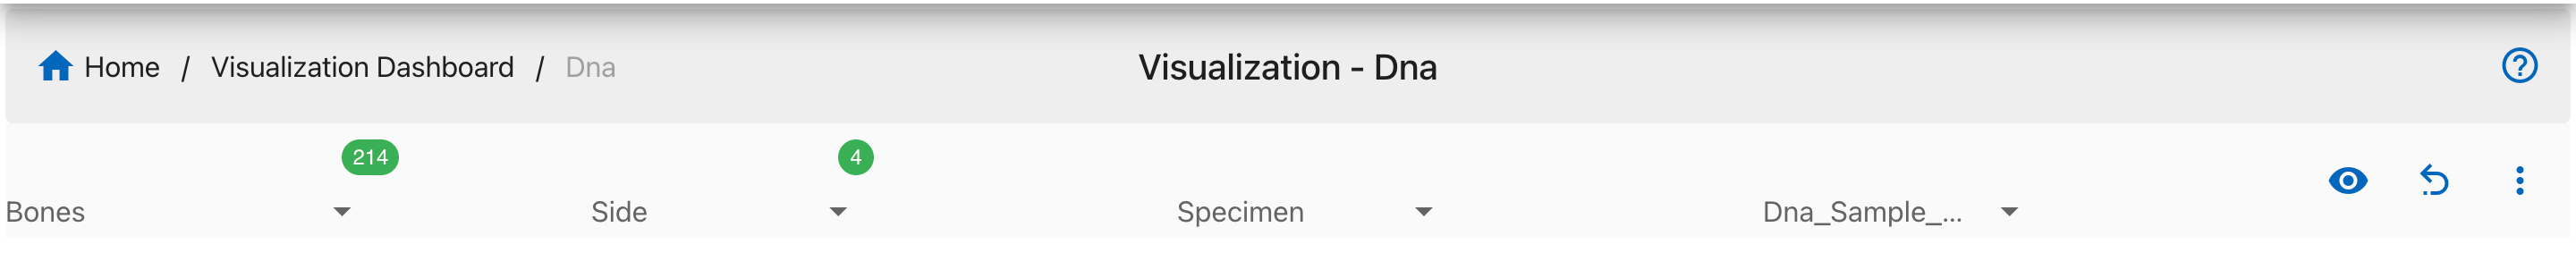
Step 1: Select Filters
Use the filter dropdowns at the top of the page to refine your selection:
- Bones: e.g., Humerus
- Side: Left or Right
- Specimen
- DNA Sample Number
These selections drive which mutations and sequences are visualized on the chart and panel.
Step 2: Select a Bone and a Side
After selecting a Bone and a Side, Specimens and Dna_Sample_Number eye-button will be available. There are two ways we can create the visualizations mentioned below: 1. A - Select a Specimen then Dna_Sample_Number will be populated
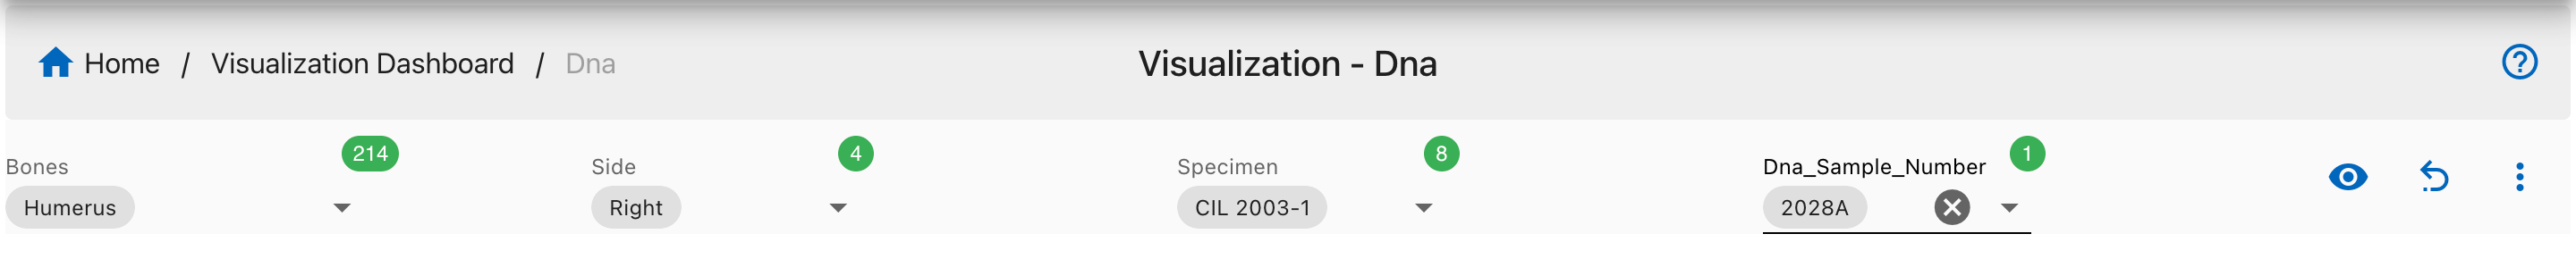
B - now when we click on eye button which will enable us to get the visualizations and its mutations.
- After selecting Bone and side we can directly select the Dna_Sample_Number.

We can see the visualization
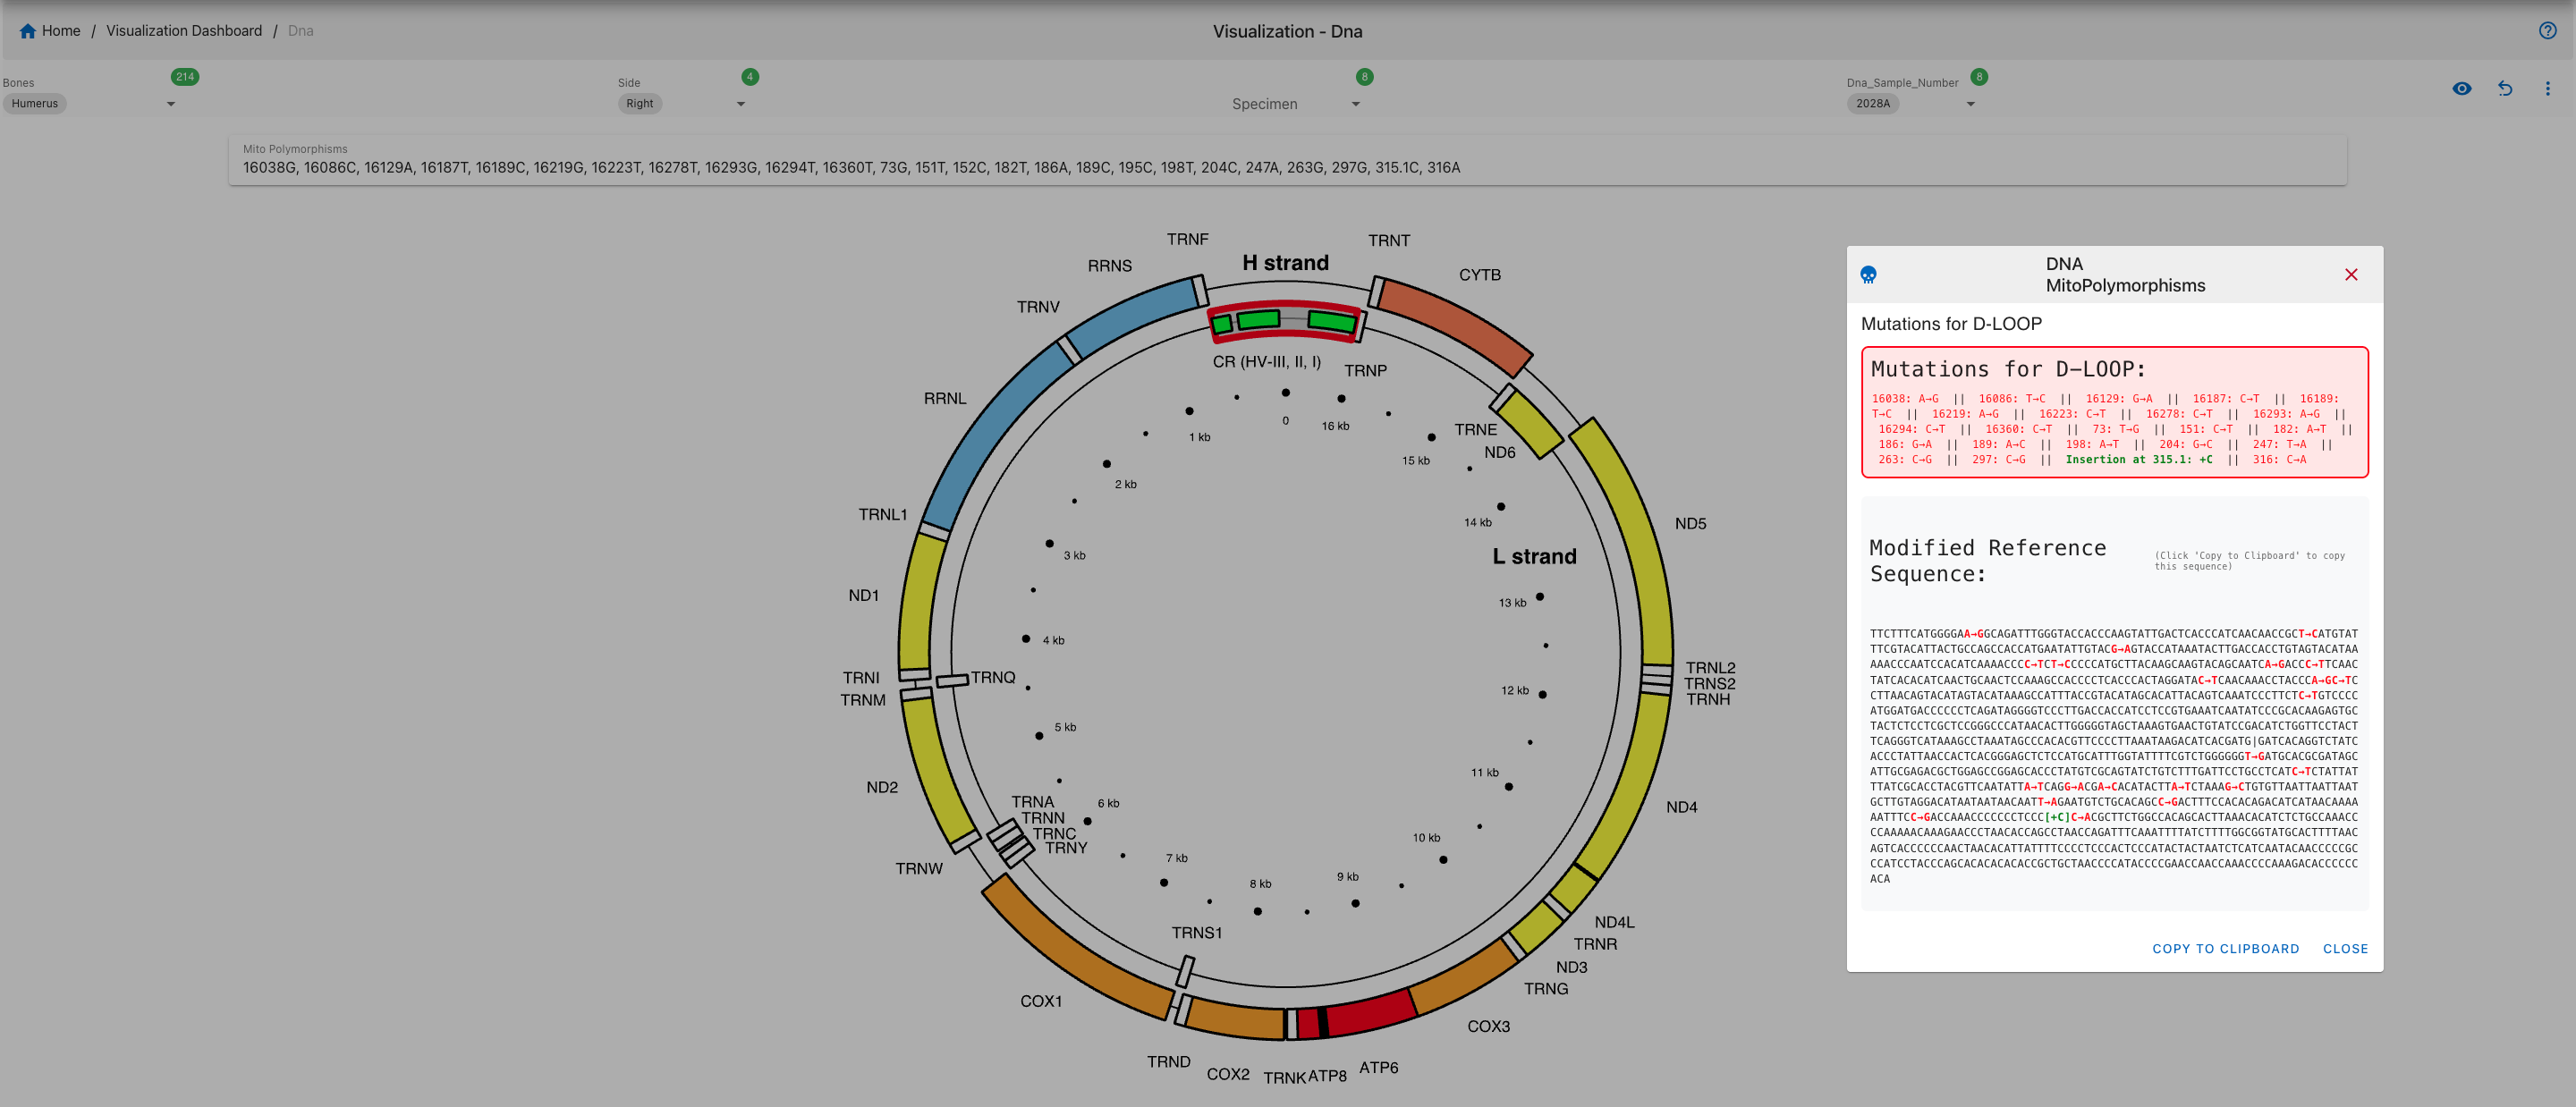
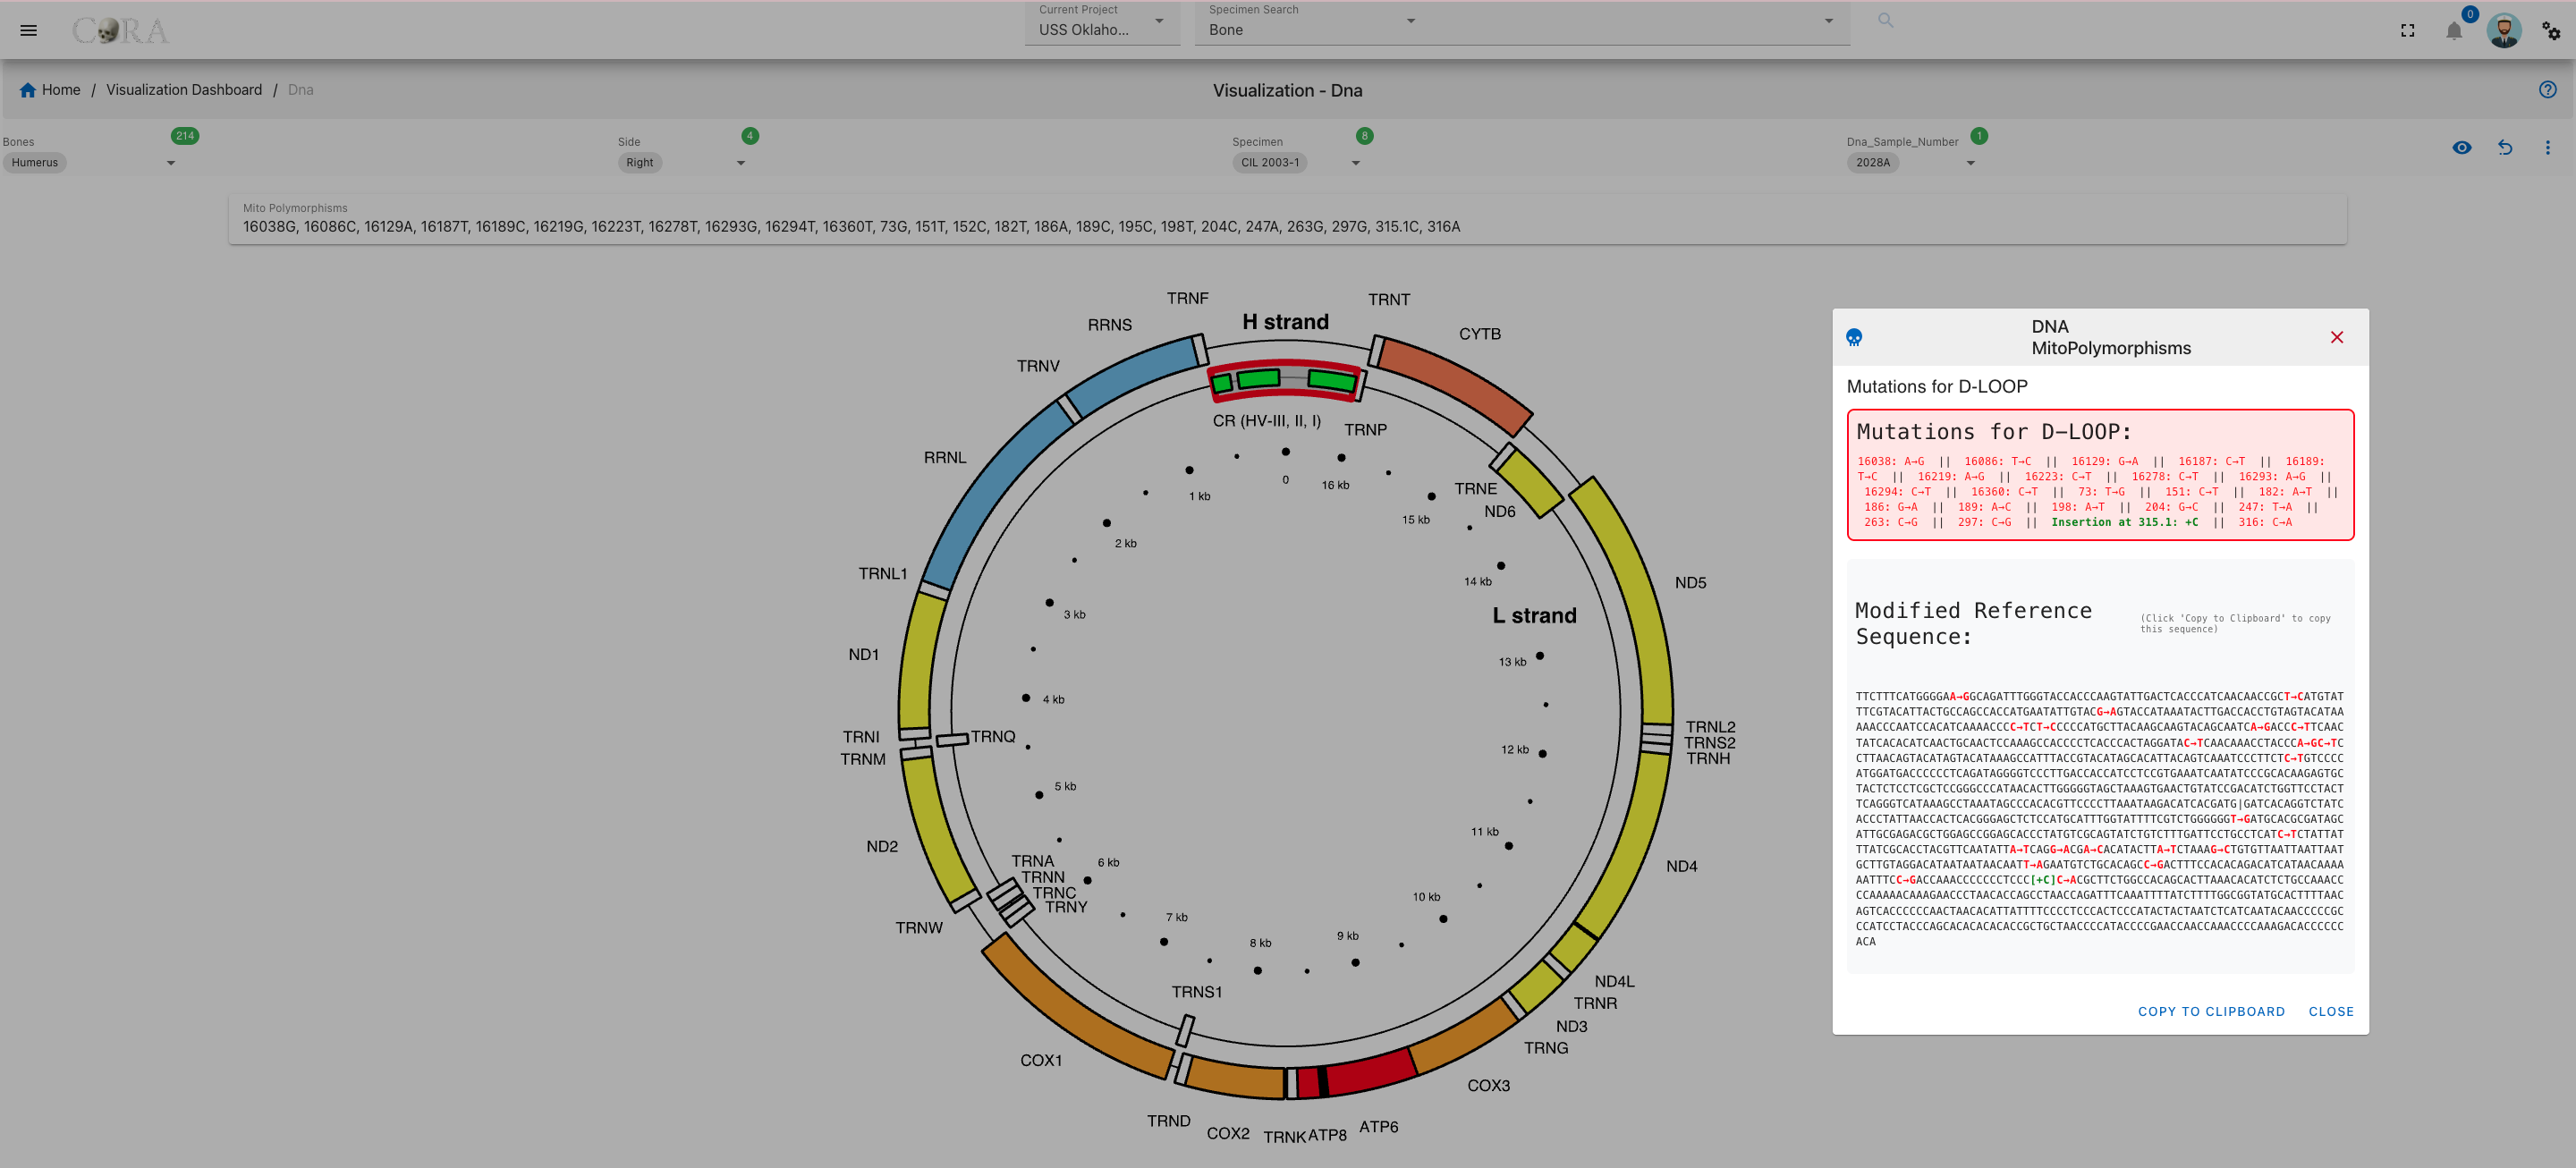
Step 3: View MitoPolymorphisms
Once a valid sample is selected, polymorphism data will be displayed in a circular mitochondrial genome viewer. respective region mutations will be highlighted.
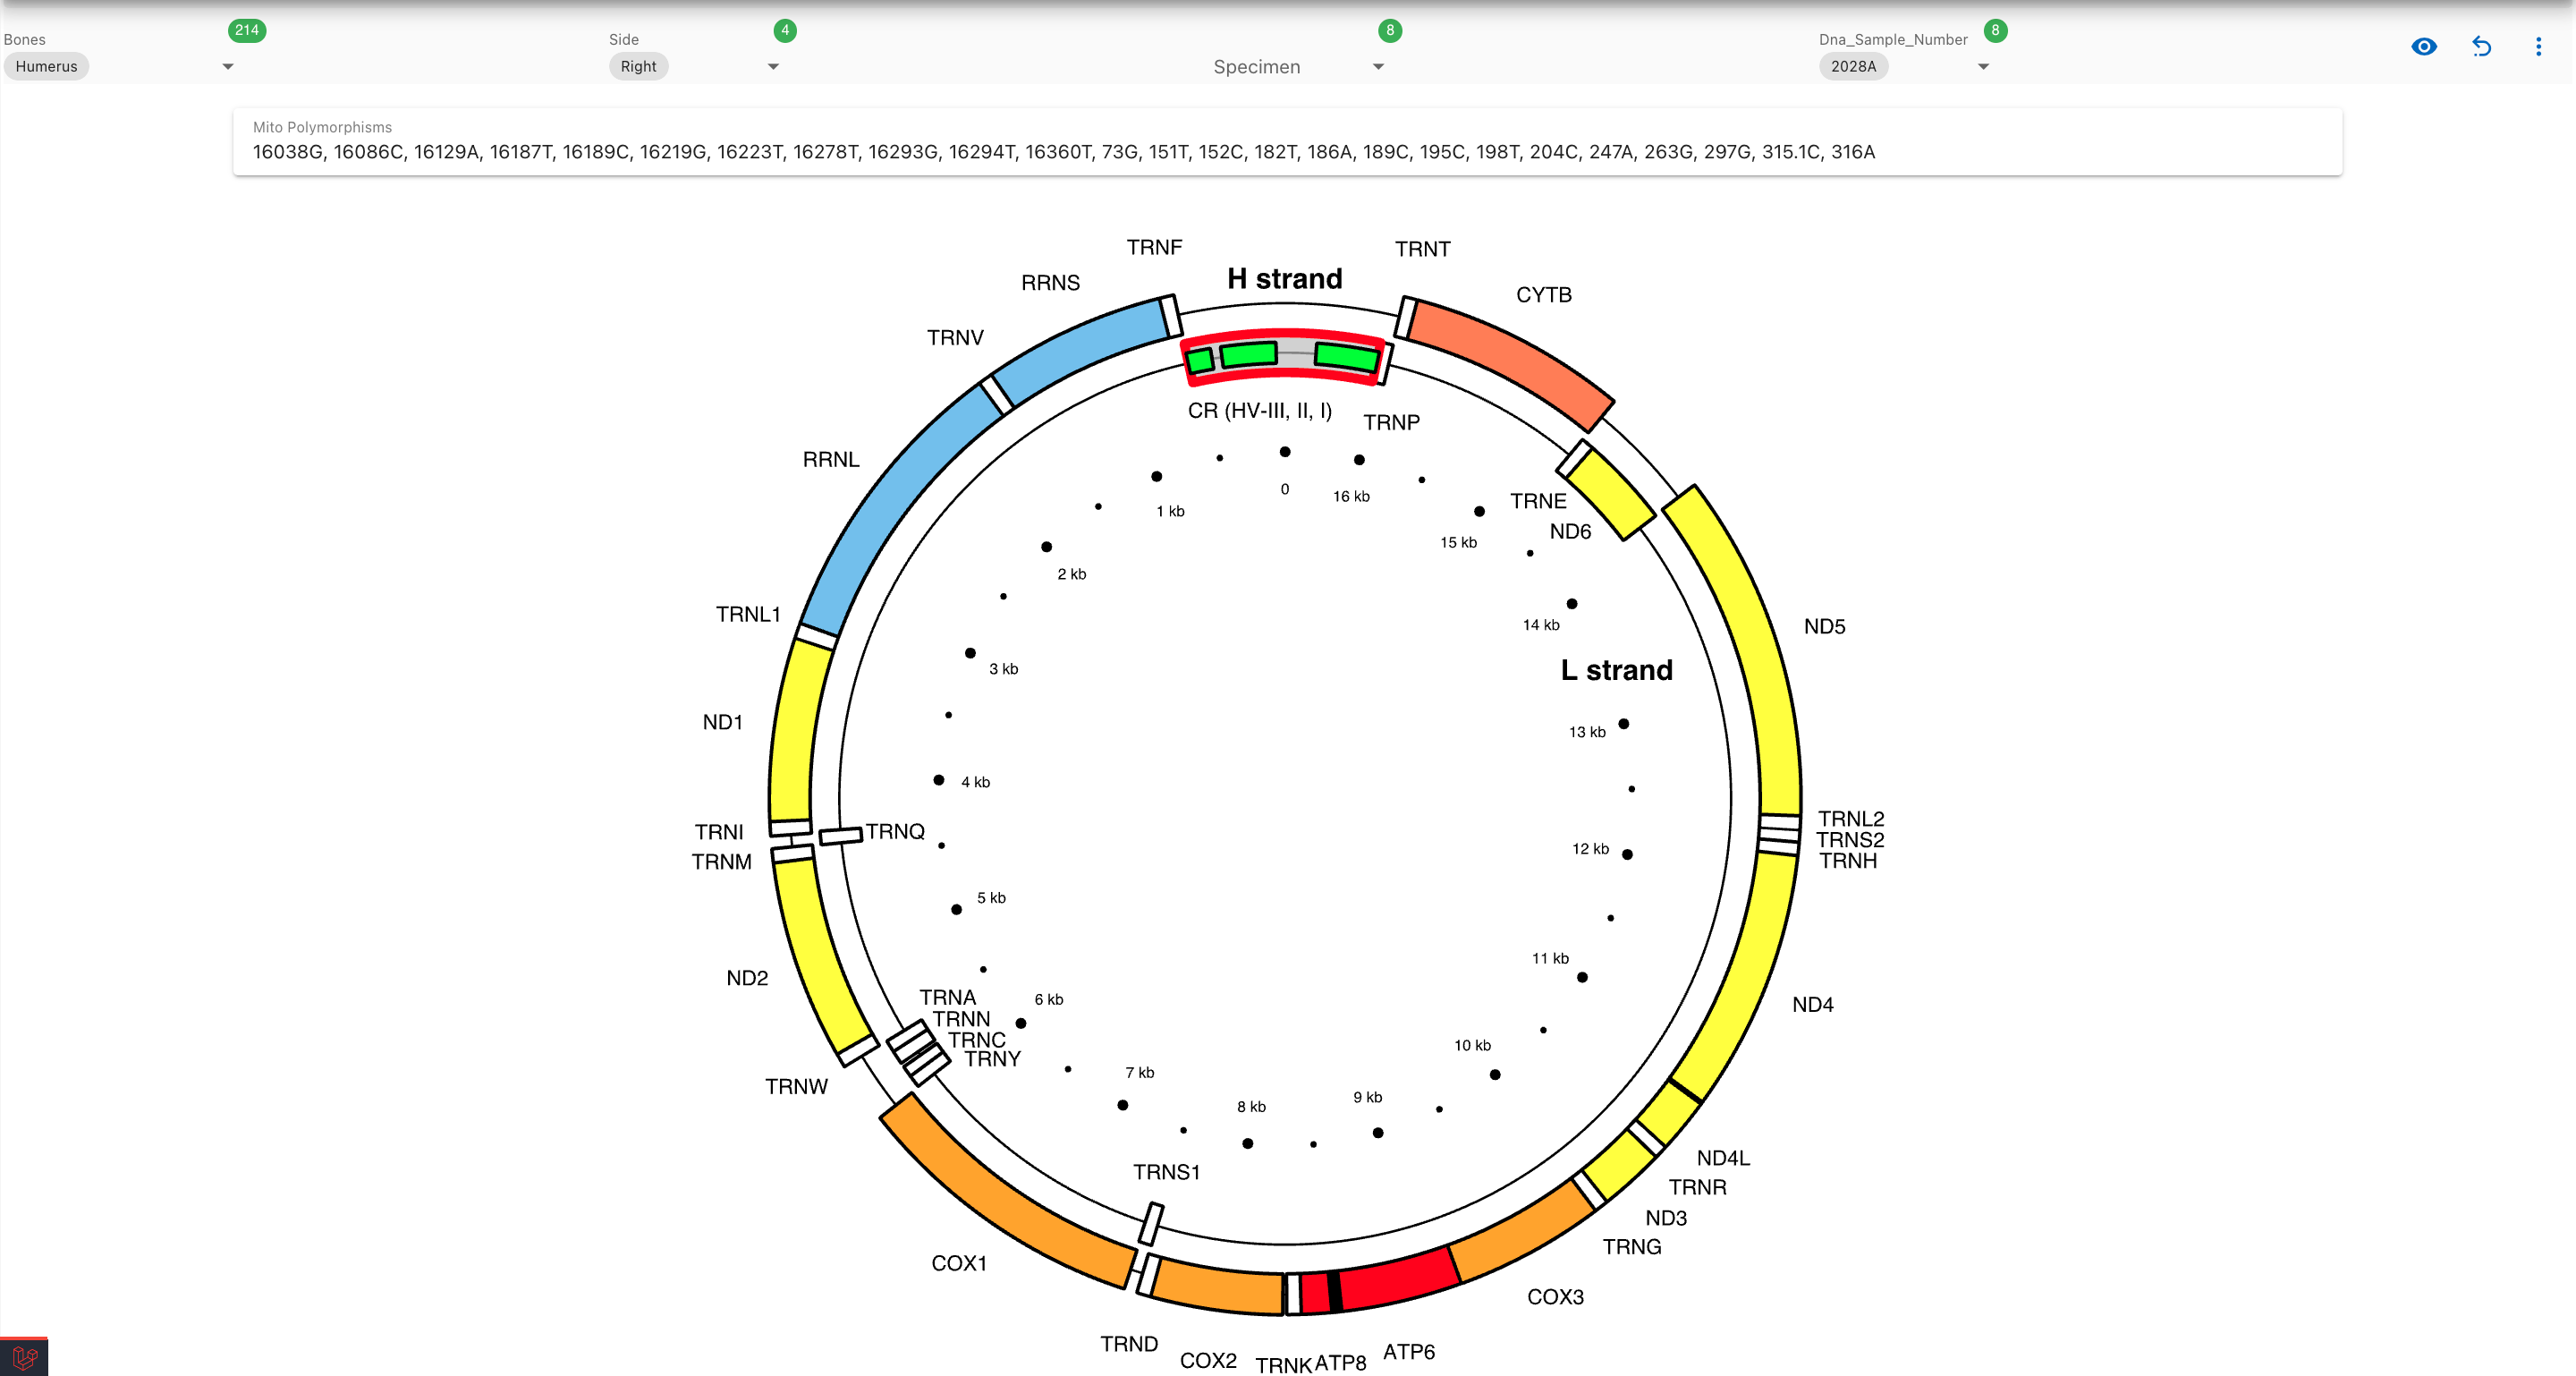
When we click on the highlighted region a mutation list is shown in a dialog box:
Created: 2025-10-15