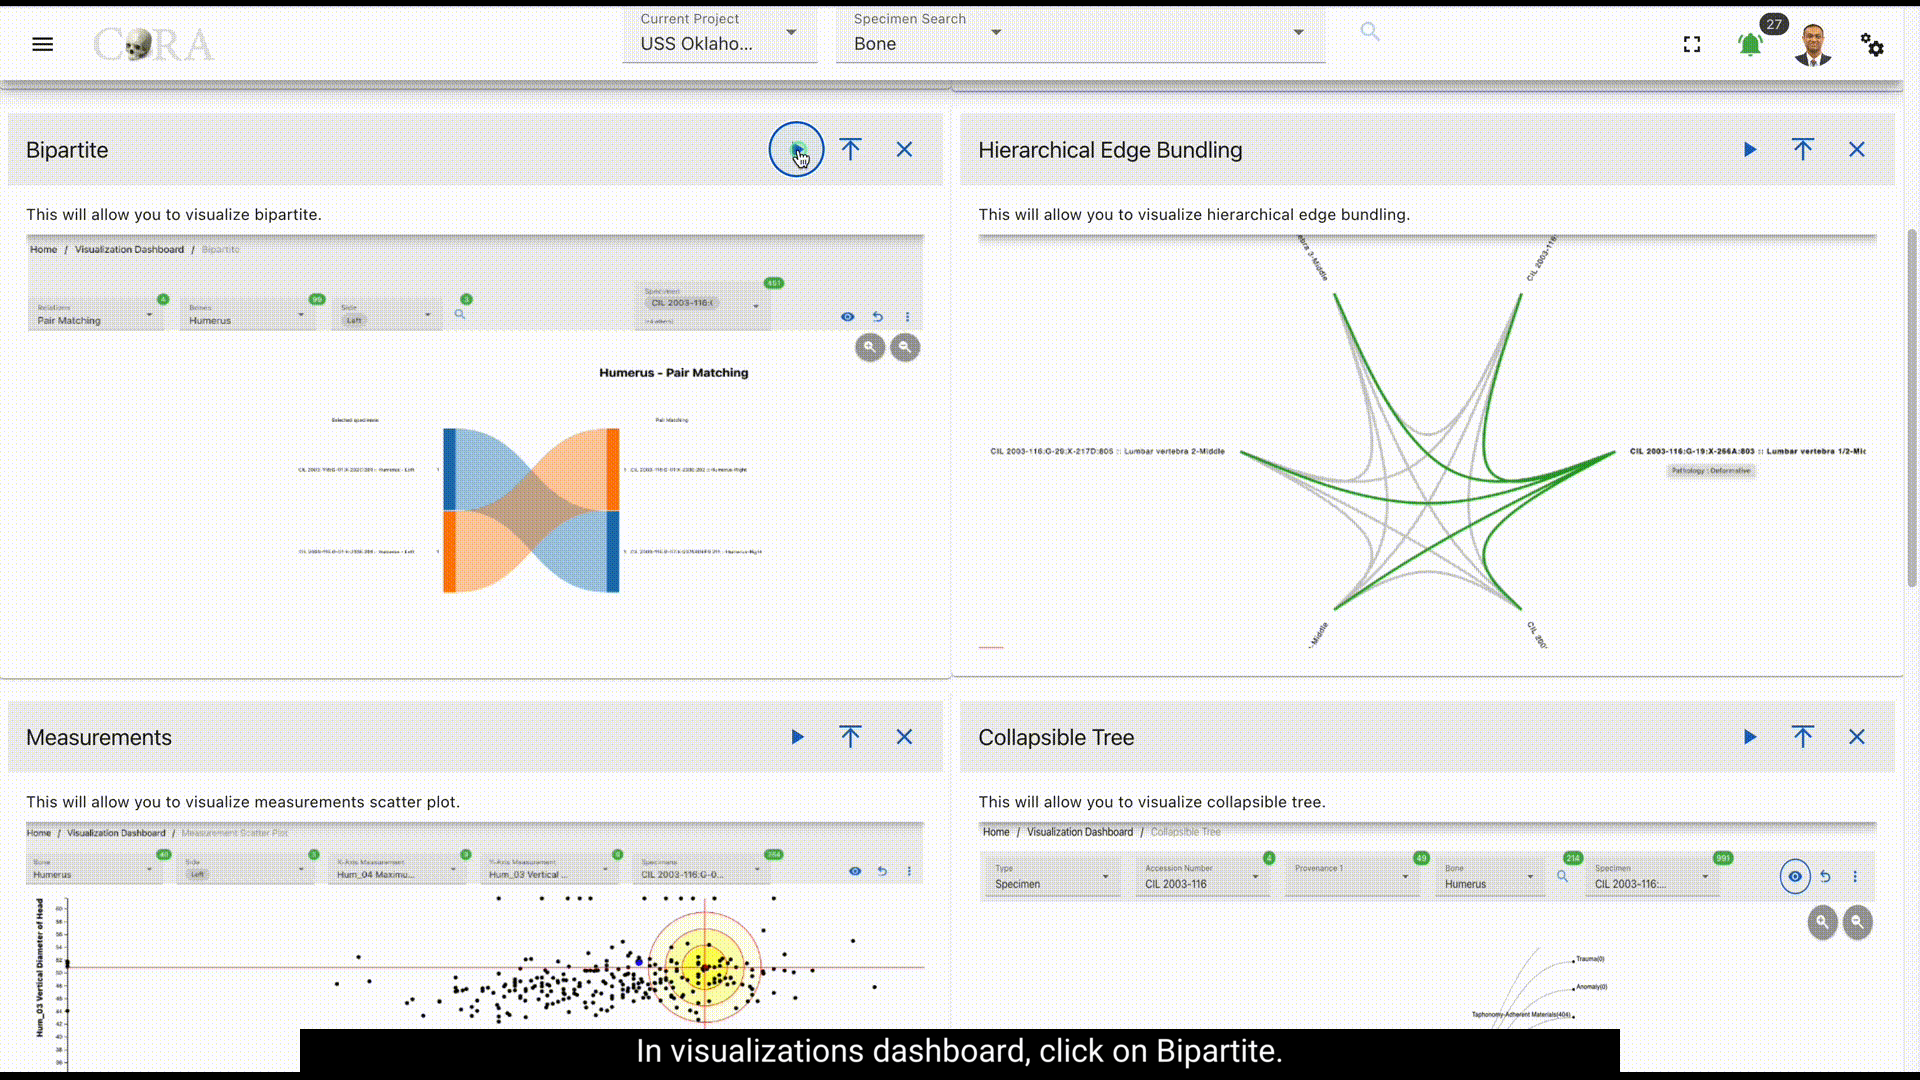
Bipartite Graph
Warning
This page is work in progress.
Bipartite Graph
A Bipartite Graph allows you to visualize the bipartite data effectively. Here CoRA use it to demonstrate the matching specimens and its relationships in the form of a bipartite graph.
The following table shows the required and optional fields to generate a bipartite graph.
| Attributes | Required/Optional |
|---|---|
| Relations | Required |
| Bones | Required |
| Side | Required |
| Specimen | Required |
Steps to generate a Bipartite Graph.
Step 1: Select a relation
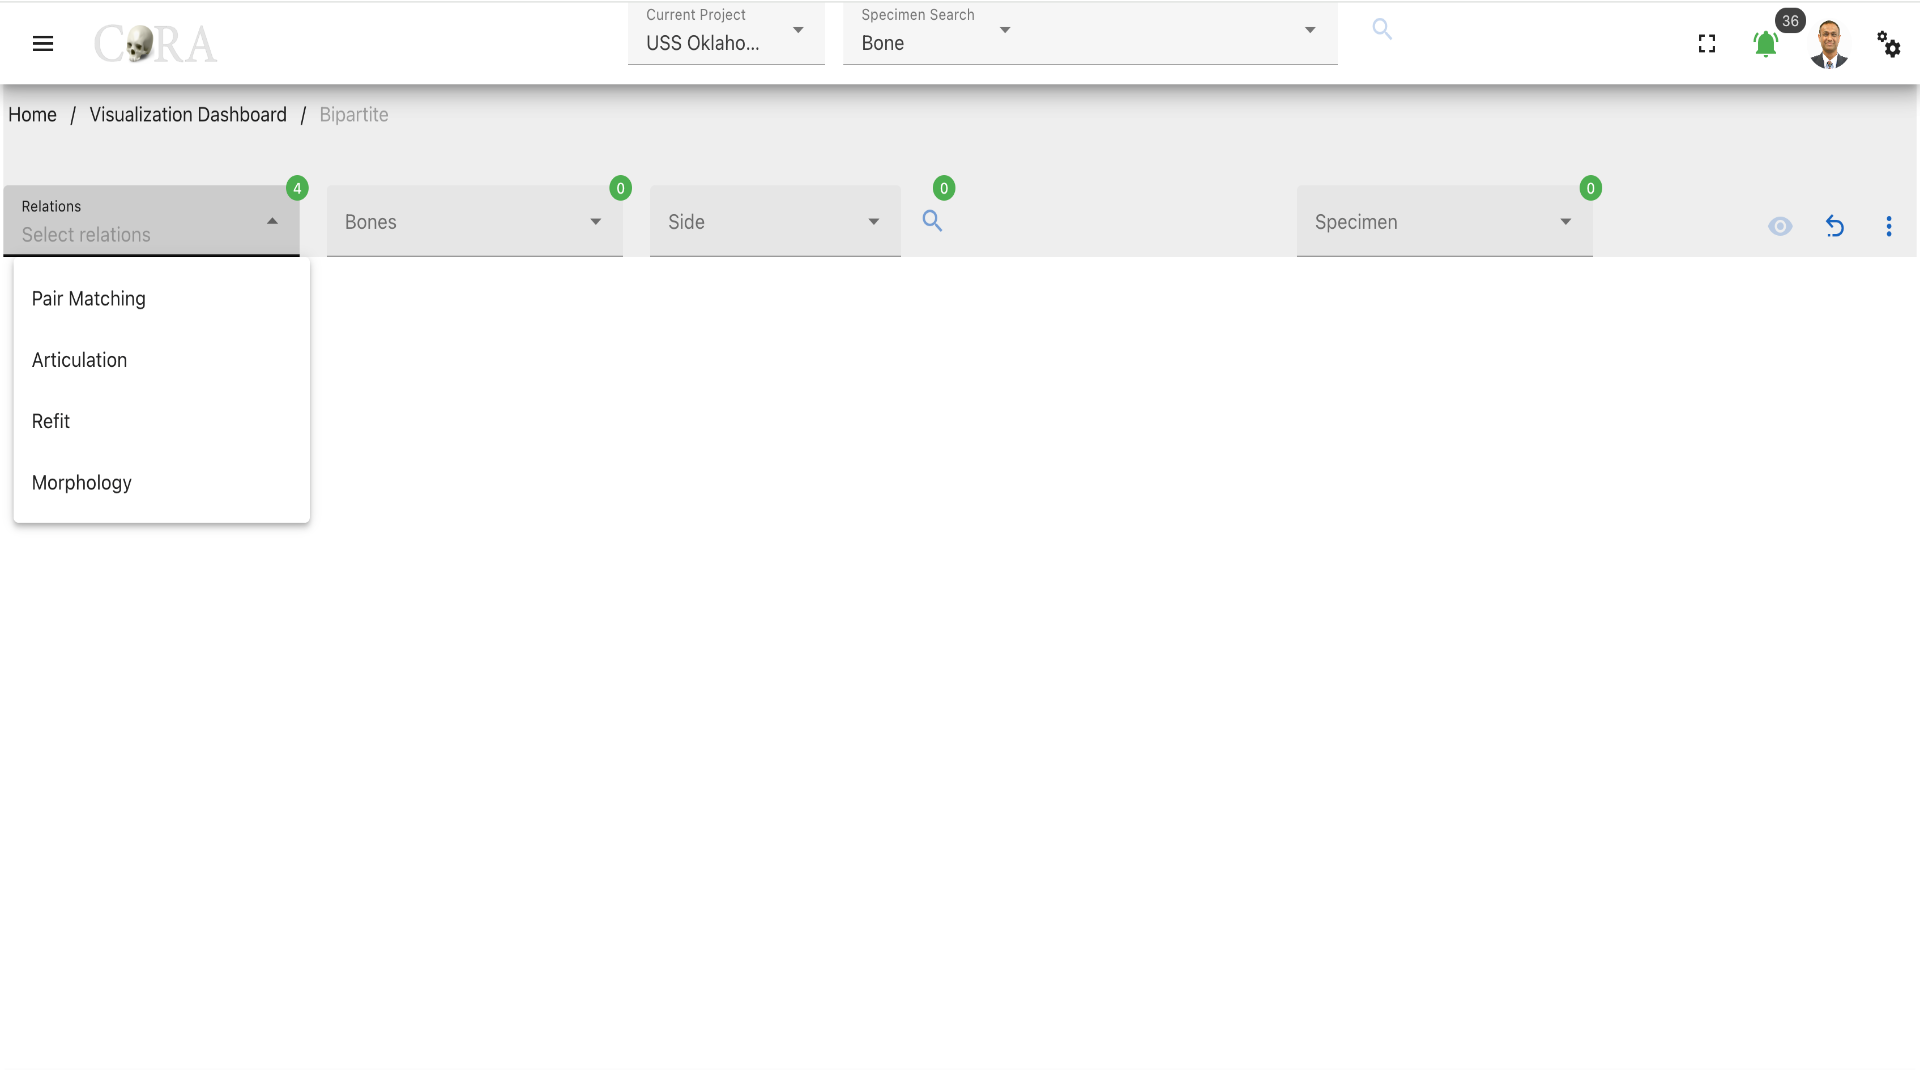
Select one from the four (4) association relations based on the requirement. The four (4) association relations available are:
- Pair Matching
- Articulation
- Refits
- Morphology
Step 2: Select a bone
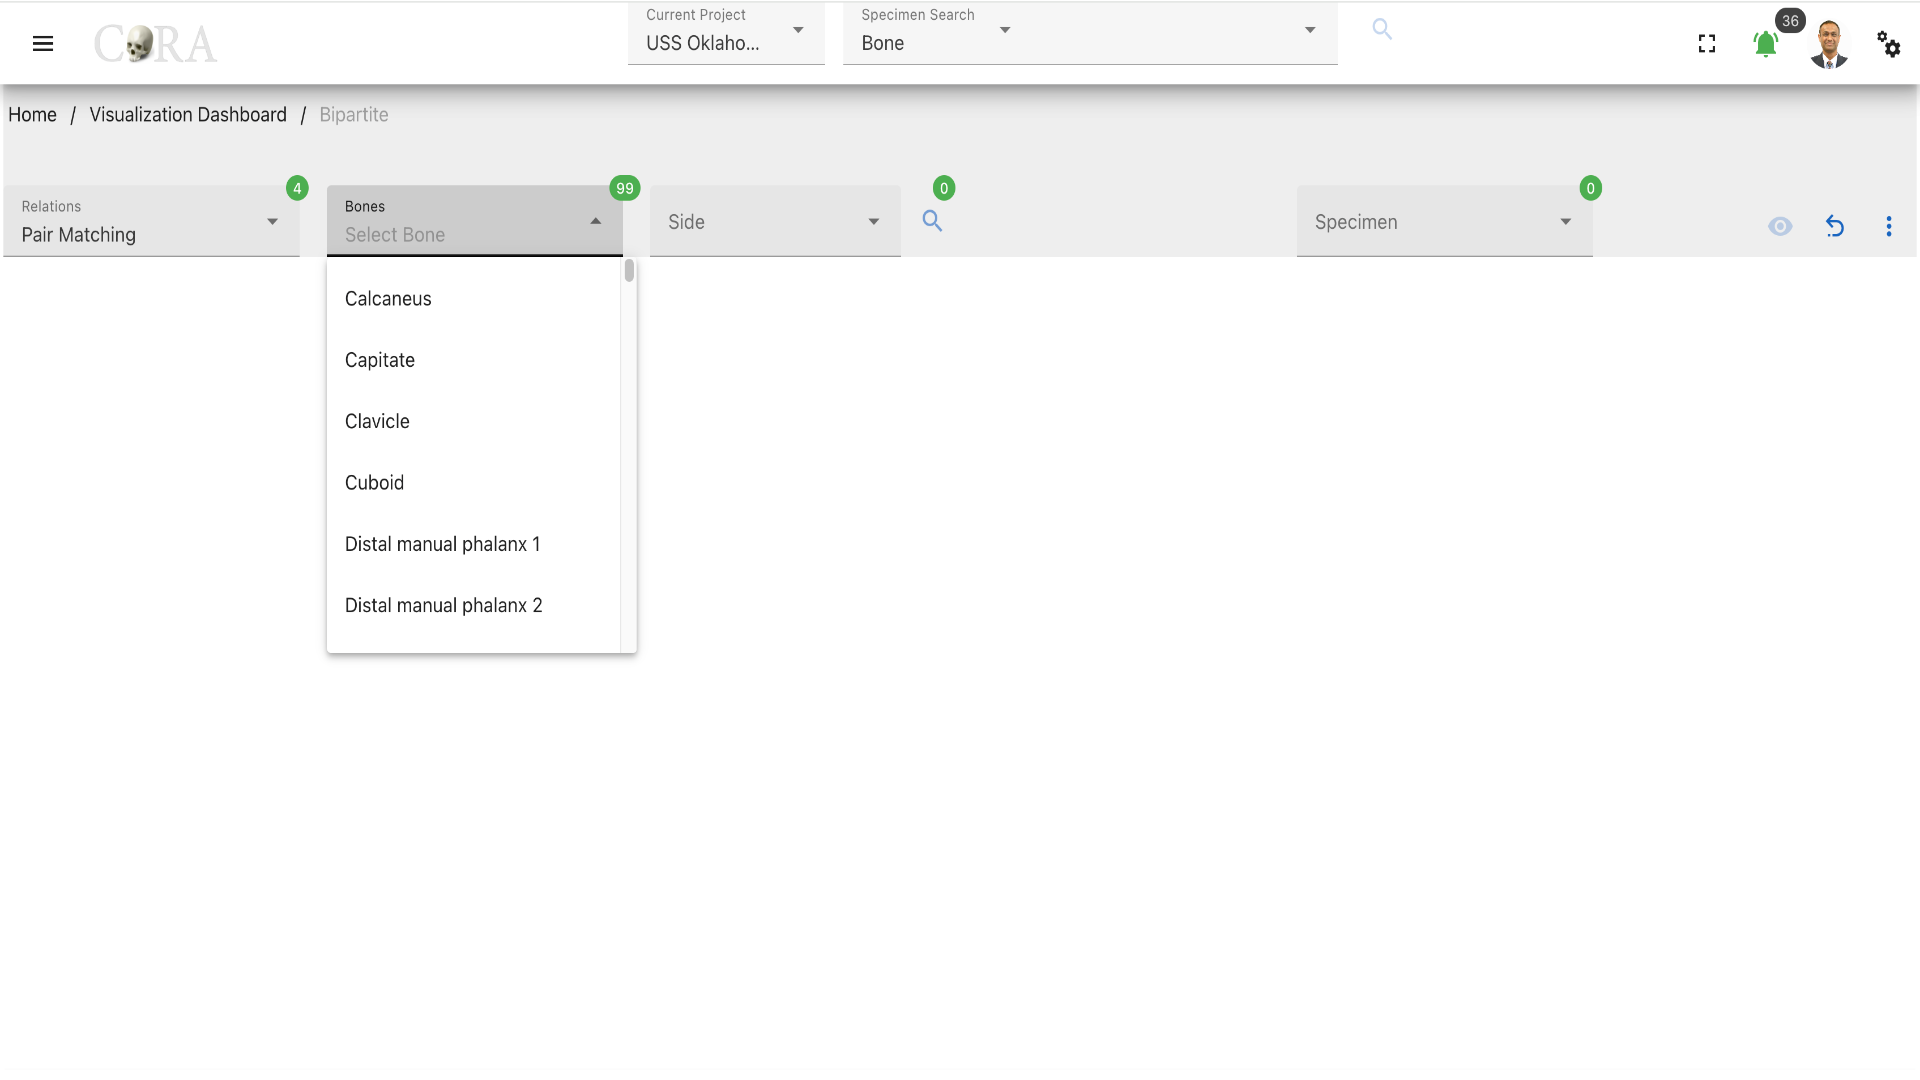
Select the bone type of the specimen from the available list of the bones required for the bipartite graph generation.
Step 3: Select a side
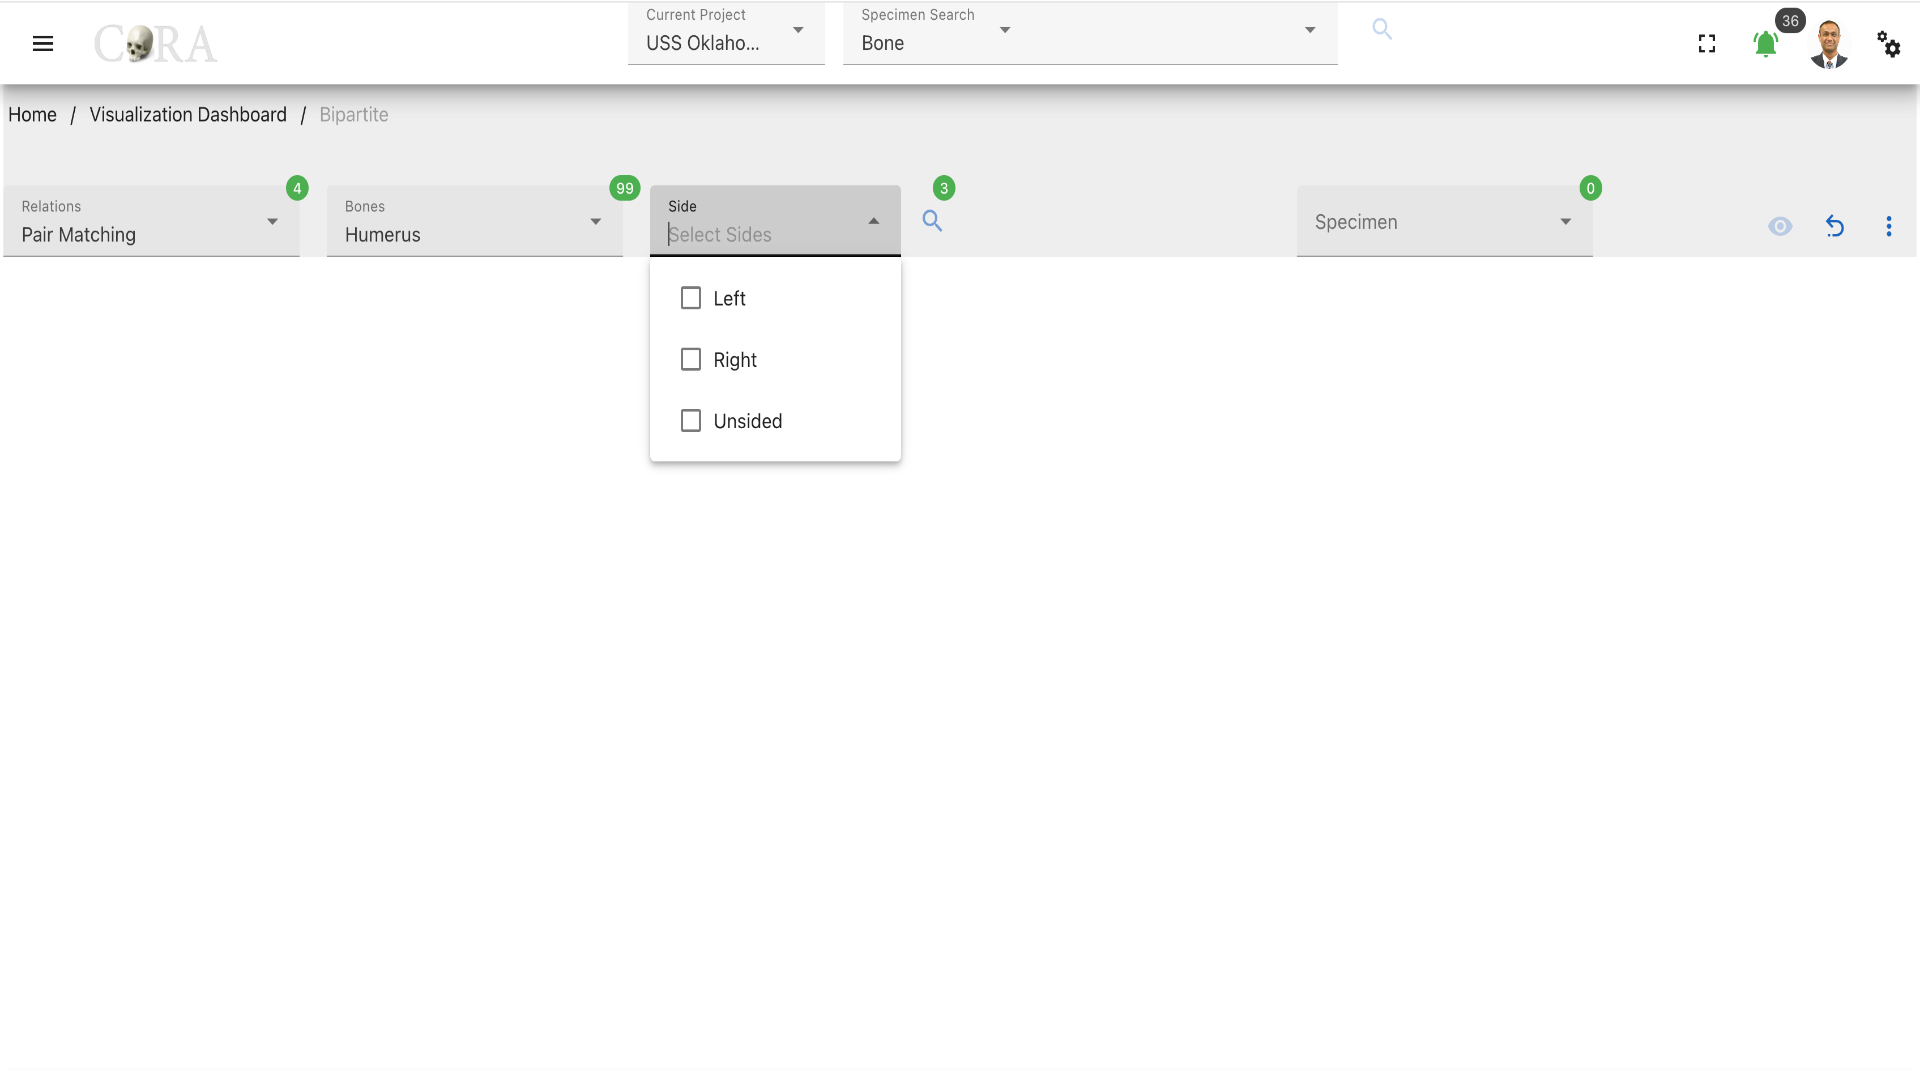 Select the bone side from the available dropdown list. After selecting the side click on the 'search' icon to generate the list of specimens based on the options selected previously. The following are the list of sides available:
- Left
- Right
- Unsided
Step 4: Select a Specimen
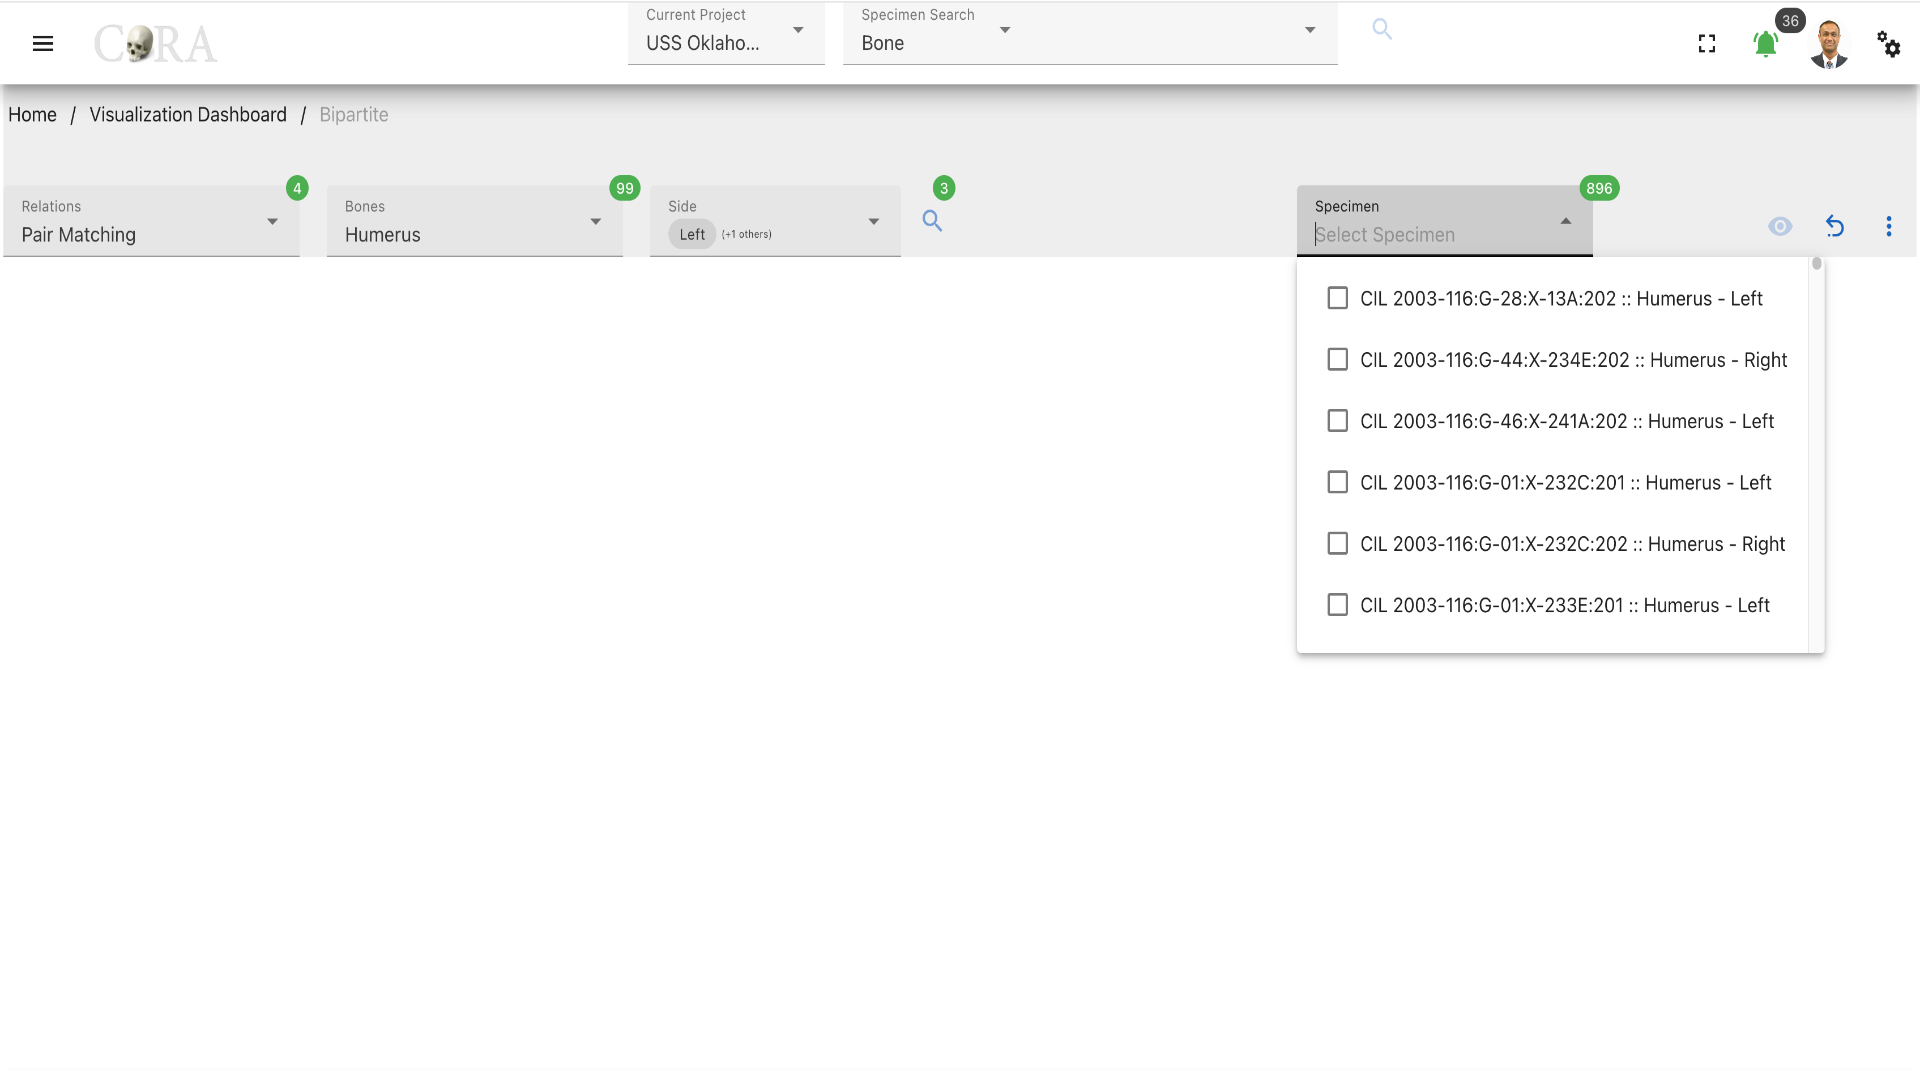 Select one or more specimen based on the analytics requirement and click on the 'eye' icon to generate the visualization. Now click on any of the colors on the generation to view the relationship in the specimen selected.
More Options/Filters
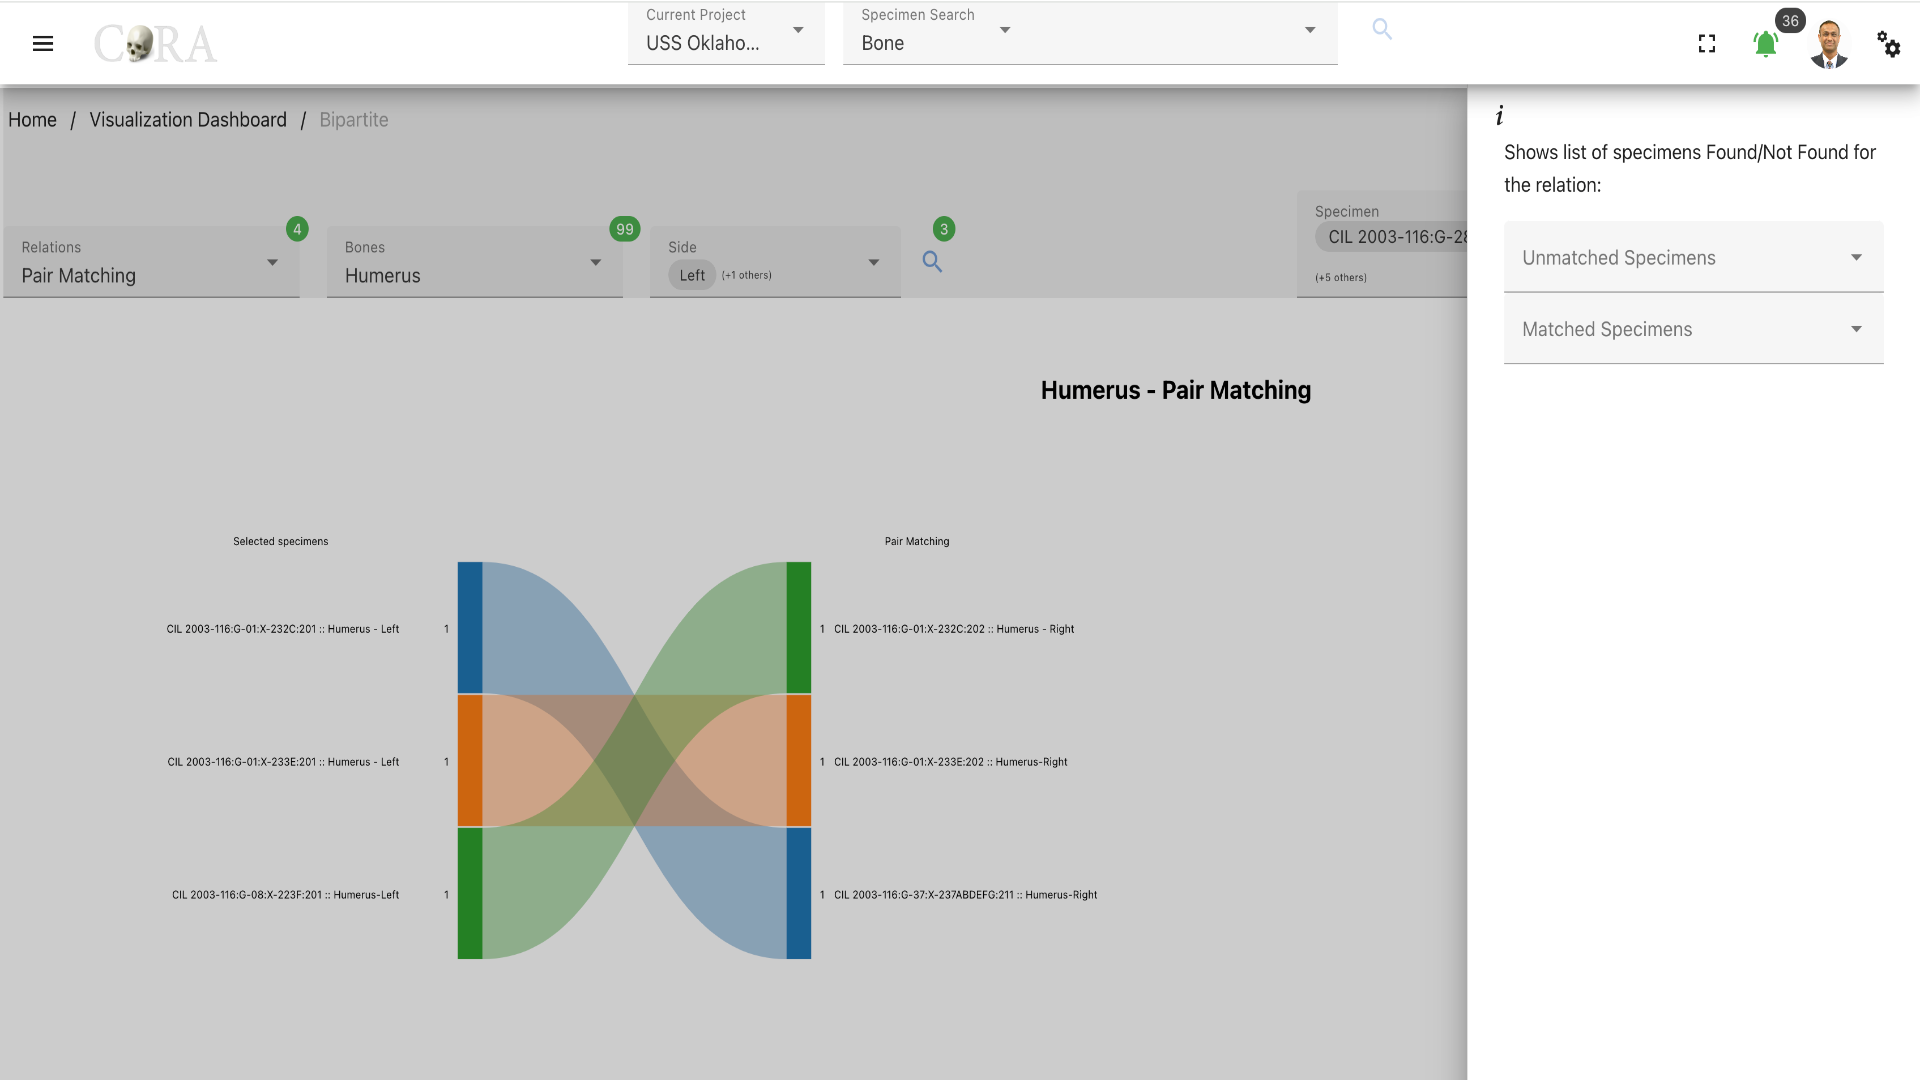 Click on the kebab menu icon to view more options of the list of specimens Found/Not Found for the relation and interact with the visualization.
Created: 2024-10-31